Main contents start here
2. Income and Expenditures by Yearly Income Quintile Group
(i) Living Expenditures
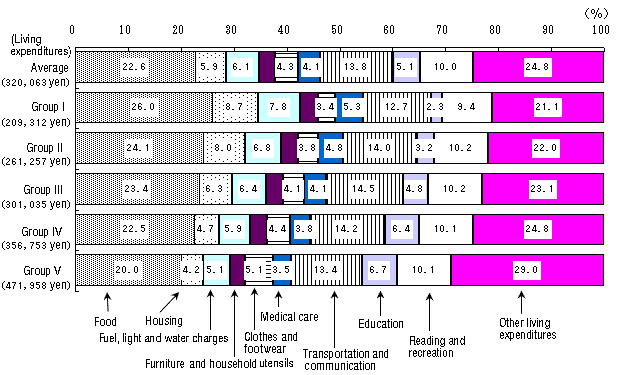
Average monthly living expenditures by yearly income quintile group shows that Group I spent 209,312 yen, Group II 261,257 yen, Group III 301,035 yen, Group IV 356,753 yen and Group V 471,958 yen. Living expenditure by Group V was 2.25 times that of Group I.
Among various expenditures items in living expenditures by yearly income quintile group, the ratios of food, housing, fuel, light & water charges, medical care were smaller in the households that have higher income. On the other hand, the ratios of clothes & footwear, education and "other living expenditures" including social expenses were greater in the households that had higher income. (Figure III-4)
Figure III-4: Composition of Average Monthly Living Expenditures Items by Yearly Income Quintile Group (All Households)
(ii) Income Differentials
The differentials in yearly income using the Gini coefficient1) in all households consistently rose from 1979 reaching 0.308 in 2004. Also, the differentials in living expenditures was analyzed using the pseudo-Gini coefficient2) was 0.163 in 2004, leveling off after rising from 1979 through 1989.
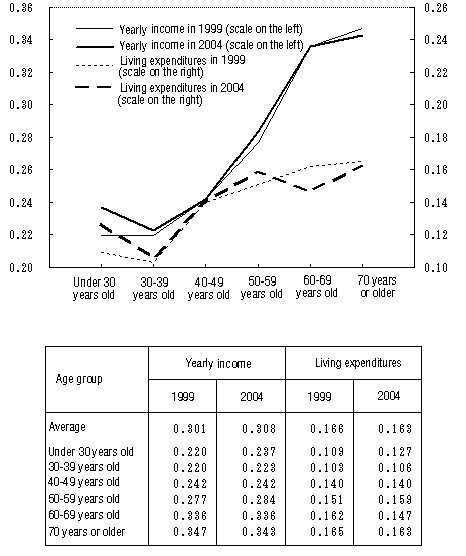
The Gini coefficient of yearly income by age group of the household heads was lowest in the households headed by those in their 30s at 0.223 and highest in the households headed by those at age 70 and over at 0.343, indicating that the coefficient tended to rise in keeping with advance in age group. Moreover, the pseudo-Gini coefficient of living expenditures was lowest in the households headed by those in their 30s at 0.106 and highest in the households headed by those at age 70 and over at 0.163.
When compared with the 1999 survey, the Gini coefficient of yearly income rose in the households headed by those under 30 and those in their 30s and 50s. Furthermore, it leveled off in the households headed by those in their 40s and 60s, and declined in the households headed by those at age 70 and over. On the other hand, the pseudo-Gini coefficient leveled off or rose in all households headed by those under 60 years old and declined in the households headed by those in their 60s and those at age 70 and over. (Figure III-5 and III-6)
Notes:
- The Gini coefficient shows the degree of concentration or inequality of distribution. The more it is closer to 0, it is more equal and the more it is close to 1, it is more unequal.
- The pseudo-Gini coefficient uses the same calculation method to measure income bracket differentials.
- The Gini coefficient of yearly income and the pseudo-Gini coefficient of living expenditures have been calculated using yearly income divided into 10 groups.
Figure III-5: Gini Coefficient of Yearly Income and Pseudo-Gini Coefficient of Living Expenditures (All Households)
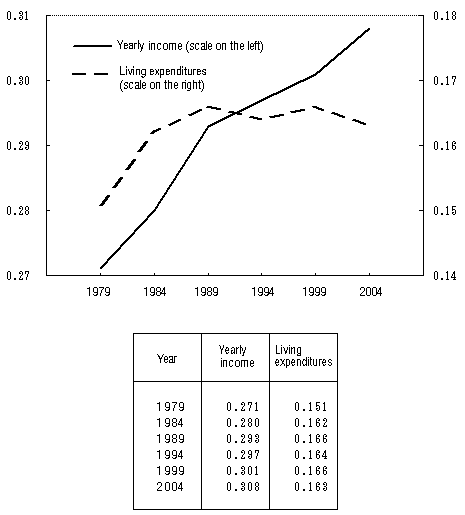
Figure III-6: Coefficient of Yearly Income and Pseudo-Gini Coefficient of Living Expenditures by Age Group of Household Head (All Households)
(iii) Outstanding Savings and Liabilities
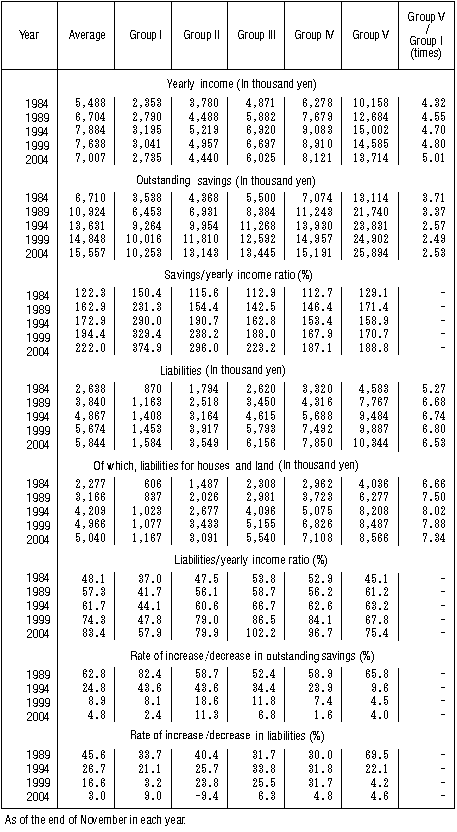
The breakdown of outstanding savings by yearly income quintile group in all households shows that Group I had 10.25 million yen per household in savings, Group II 13.14 million yen, Group III 13.45 million yen, Group IV 15.19 million yen, Group V 25.89 million yen. Group V had 2.53 times as much savings per household as those of Group I.
In terms of liabilities by yearly income quintile group, Group I had 1.58 million yen per household in liabilities, Group II 3.55 million yen, Group III 6.16 million yen, Group IV 7.85 million yen and Group V 10.34 million yen. Group V had 6.53 times as much liabilities per household as those of Group I.
When compared with the 1999 survey, outstanding savings increased in each group and, in particular, Group II shows an increase of 11.3%. On the other hand, liabilities increased in all groups except for Group II which recorded a decline of 9.4%. (Table III-2)
Table III-2: Changes in Outstanding Savings and Liabilities by Yearly Income Quintile Group (All Households)
Go to III-3. Income and Expenditures by Type of Households
![]()
![]()