Main contents start here
![]()
1997 Employment Status Survey Preliminary Results by Urban and Rural -ken
Released on 29 June, 1997
- The Employment Status Survey collects information based on usual employment/unemployment situation (usual method). On the other hand, the Labor Force Survey collects information based on actual employment/unemployment situation during the last week of each month (actual method). Therefore, the figures between the above two surveys are not always comparable.
- Since the results in this page are preliminary one, they may not coincide with the final results to be compiled in the nearfuture.
![]() is "Portal Site of Official Statistics of Japan" (external site) where you can browse statistics tables and database.
is "Portal Site of Official Statistics of Japan" (external site) where you can browse statistics tables and database.
|
|
|
| I Outline of results | |
| 1.Working persons | 2.Persons wishing to work |
| 3.Part-timers and side-workers | 4.Methods used to seek a job |
| 5.Working persons by industry | |
| II Main Statistical Tables |
|
[Outline of results] [Explanation of terms]
I Outline of results
1. Working persons
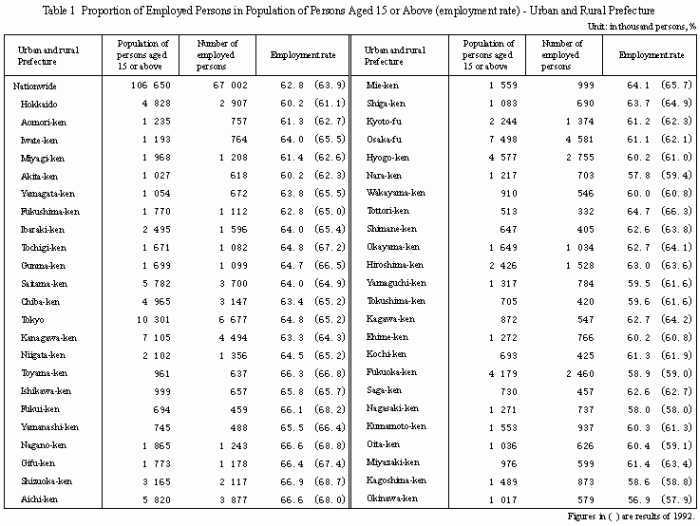
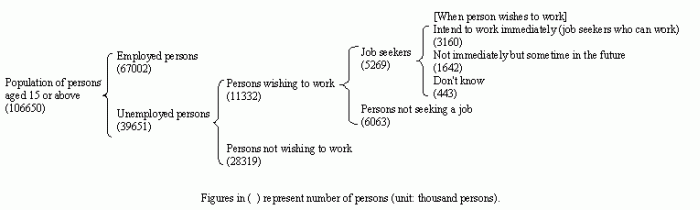
Of the total population of Japan aged over 15 (166.5 million persons), 67,002,000 are working and 39,651,000 are not working. The proportion of population aged over 15 who have jobs (employment rate) is 62.8%. This is 1.1 points less than in 1992.
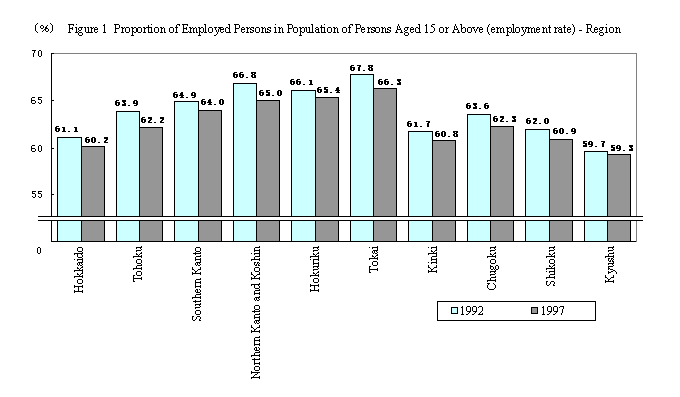
By district, the highest rate of employment is 66.3% in Tokai, followed by 65.4% in Hokuriku, and 65.0% in Northern Kanto - Koshin. Since 1992 the rate has, relative to other districts, declined steeply in some districts, such the 1.8-point fall in Northern Kanto - Koshin and by the 1.7-point fall in Tohoku (Fig. 1).
By prefecture, as compared with 1992, the rate has declined (Table 1).
2. Part-time work and side-work (arubaito)
Of the 54,999,000 working persons, at 70.1% (38,543,000), regular staff and ordinary employees comprise the major form of employment. Part-time workers account for 12.7% (6,998,000), and side-workers 6.1% (3,341,000) of the total.
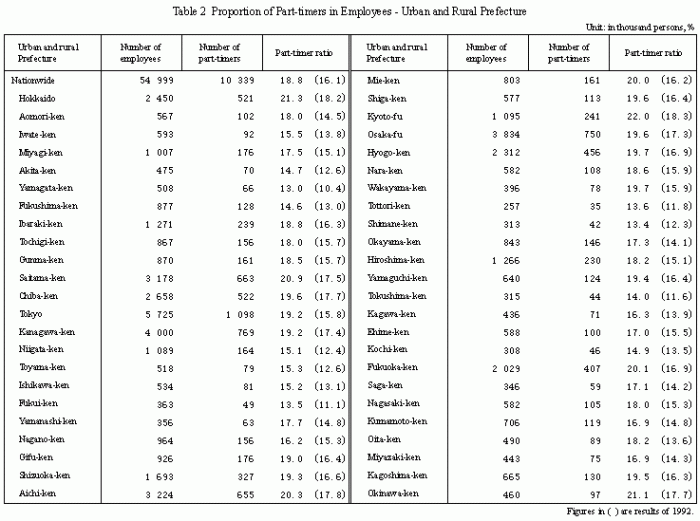
The number of part-time and side-workers is 18.8% of those in work, a 2.7-point rise since 1992.
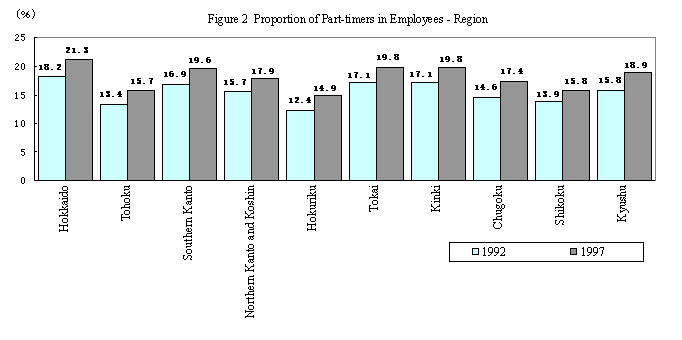
By district, at 21.3%, Hokkaido has the highest rate of part-time and side work, followed by Tokai and Kinki (19.8%), Southern Kanto (19.6%), and Kyushu (18.9%). The figures rose in each district since 1992, including a 3.1-point rise in Hokkaido and Kyushu, and a 2.8-point rise Chugoku (Fig. 2).
Since 1992, by prefecture, there was a 4.6-point rise in Oita prefecture, 3.8-point rises in Mie prefecture and Wakayama prefecture, and a 3.7-point rise in Kyoto prefecture (3.7-point rise) (Table 2).
3. Working persons by industry
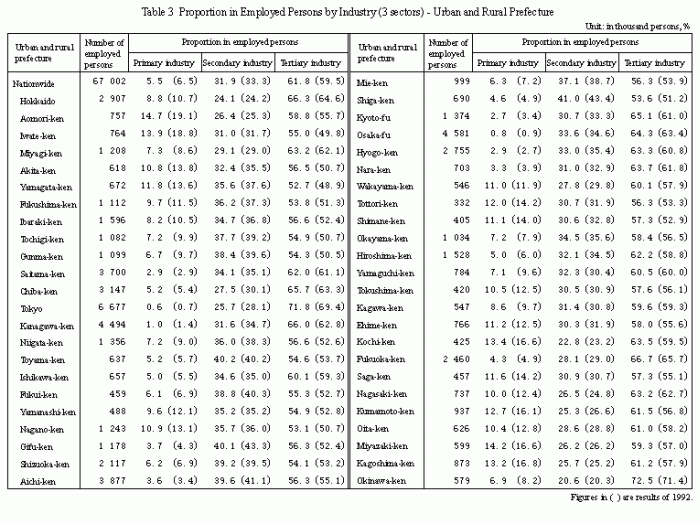
The 3,657,000 persons working in the primary sector account for 5.5% of working persons. The figures for the secondary sector are 31.9% (21,364,000) and 61.8% (41,418,000) for the tertiary sector. Since 1992 there was a 1.0-point decline in the primary sector, a 1.0-point decline in the secondary sector, and a 2.3-point rise in the tertiary sector.
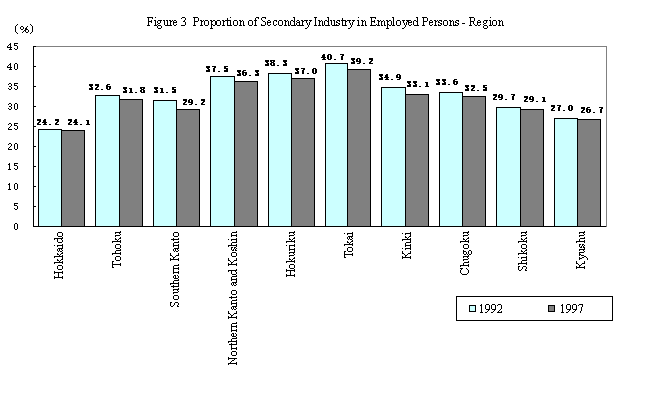
By district, the highest proportion of workers in the secondary sector is 39.2% in Tokai, followed by Hokuriku (37.0%), and Northern Kanto - Koshin (36.3%). This figure declined in every district since 1992, and was down 2.3 points in Southern Kanto, 1.8 points in Kinki, and 1.5 points Tokai (Fig. 3).
Since 1992, the proportion of workers in the secondary sector also declined in nearly every prefecture (Table 3).
4. Persons wishing to work
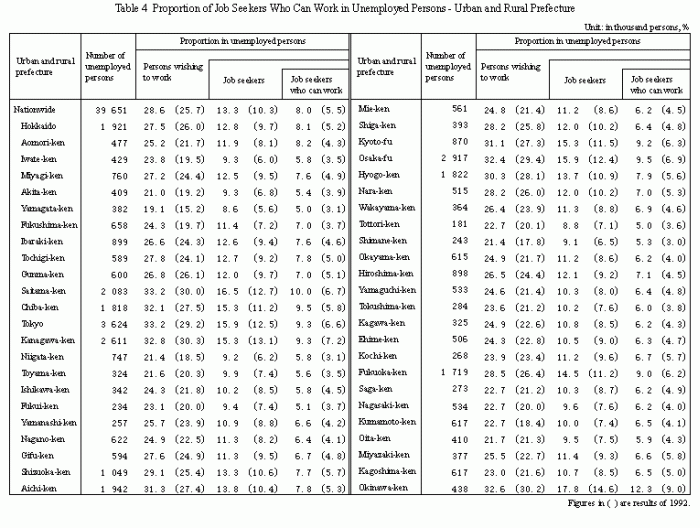
Among the 39,651,000 not working persons, 11,332,000, or 28.6%, wished to work. Of these, there were 5,269,000 job seekers (persons actively making efforts to or preparing to find employment). This figure represents 13.3% of not working persons, a 3.0-point rise since 1992.
There were 3,160,000 job seekers with good prospects (persons who expected to get a job soon). This represents 8.0% of not working persons, a 2.5-point rise since 1992.
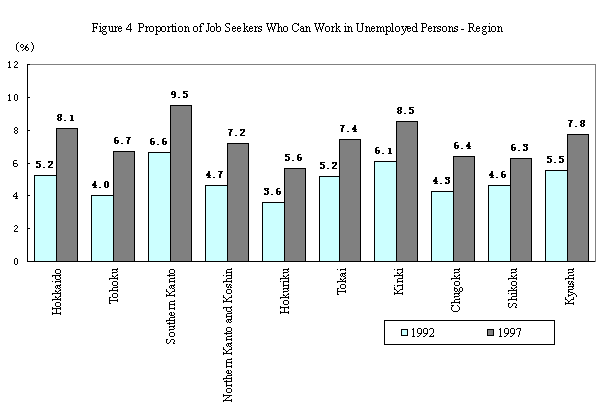
Regionally, among not working persons, the highest proportion of job seekers with good prospects was 9.5% in Southern Kanto, followed by 8.5% in Kinki, and 8.1% in Hokkaido. Since 1992, this figure jumped in all districts, including a 2.9-point rise in Hokkaido and 2.9-point rise in Southern Kanto (Fig. 4).
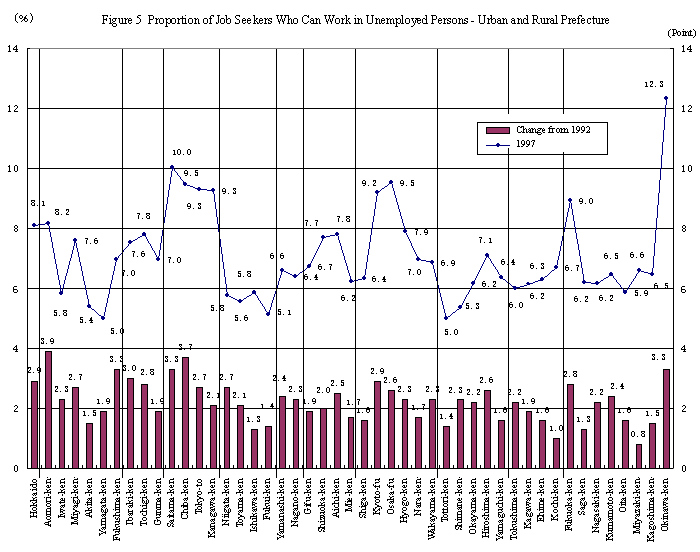
In prefectures, at 12.3%, the proportion of job seekers with good prospects was highest in Okinawa prefecture, followed by Saitama prefecture (10.0%), Chiba prefecture and Osaka prefecture (both 9.5%). Each prefecture showed a large increase since 1992, including 3.9 points in Aomori prefecture, 3.7 points in Chiba prefecture, and 3.3-point rises in Fukushima prefecture, Saitama prefecture and Okinawa prefecture (Fig. 5, Table 4)
Reference
5. Methods used to seek a job
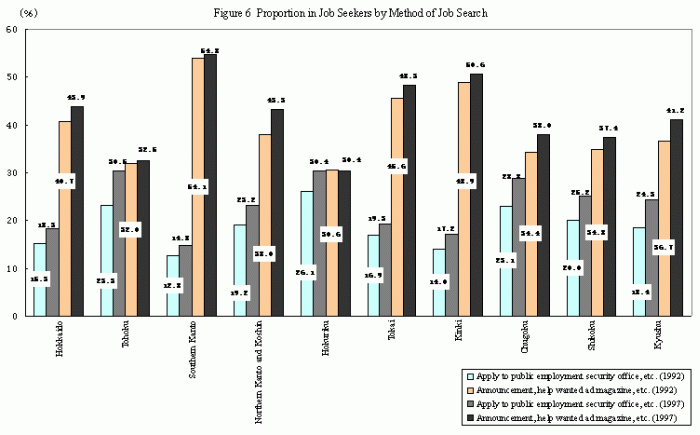
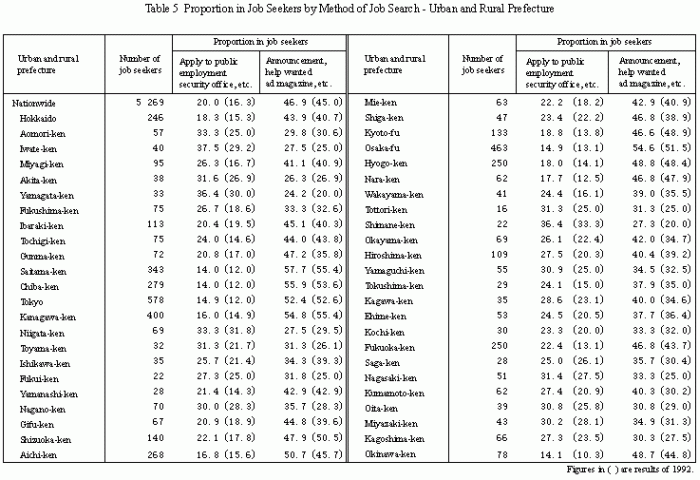
Looking at the 5,269,000 job seekers by methods used to seek a job, "Classified advertisements, recruting magazines, etc." was the most used method: 46.9%. Followed by "Applications to the public employment security office": 20.0%, "Consultation with friends or acquaintance": 16.8%. Since 1992 the figures for the first two methods have risen by 1.9 and 3.7-points, while the third method has declined by 5.2 points.
Looking at "Applications to the public employment security office" by district, Tohoku has the highest proportion, 30.5%, followed by Hokuriku (30.4%), and Chugoku (28.8%). Since 1992 this figure rose in all districts, including by 7.2 points in Tohoku, 5.9 points in Kyushu, and 5.7 points in Chugoku.
Looking at "Classified advertisements, recruting magazines, etc.", the highest use was Southern Kanto (54.8%), followed by Kinki (50.6%), and Tokai (48.3%). Except for a 0.2-point decline in Hokuriku, since 1992 this figure rose in every district, including Northern Kanto - Koshin (5.3-point rise), Kyushu (4.5-point rise), and Chugoku (3.6-point rise) (Fig. 6).
In nearly every prefecture "Applications to the public employment security office" increased since 1992, including 9.6-point rises in Miyagi prefecture and Toyama prefecture, a 9.4-point rise in Tochigi prefecture, and a 9.3-point rise Fukuoka prefecture. There was a greater use of "Classified advertisements, recruting magazines, etc." in most prefectures, including Gunma prefecture (11.4-point rise), Kumamoto prefecture (10.1-point rise), and Shiga prefecture (7.9-point rise) (Table 5).
![]()
![]()