Main contents start here
![]() .
.
2. Population by Age
Population aged under 15 years old was 13.7% of the total population, aged 15 - 64 years old was 65.8% and aged 65 years old and over was 20.1%.
- The population by age group showed that 17,521,234 (13.7% of the total population) were those aged under 15 years old, 84,092,414 (65.8%) were those aged 15 to 64 years old and 25,672,005 (20.1%) were those aged 65 years old and over.
- The population aged under 15 years old decreased by 951,265 (5.1%) from 2000. The ratio to the total population also fallen by 0.9 percentage points to the lowest level since the survey started.
- The population aged 15 to 64 years old decreased by 2,127,217 (2.5%) from 2000. The ratio to the total population also fallen by 2.1 percentage points.
- The population aged 65 years old and over increased by 3,666,853 (16.7%) from 2000.
The ratio to the total population increased by 2.8 percentage points to the highest level since the survey started.
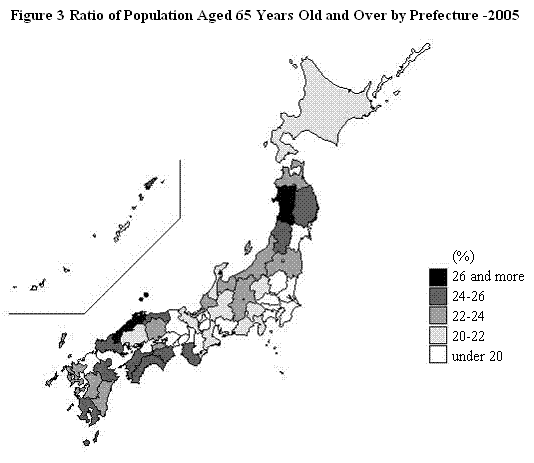
- As for the ratio of population aged 65 years old and over to the total population by prefecture, Shimane-ken had the highest ratio (27.1%) and Okinawa-ken the lowest (16.1%). The ratio increased in all prefectures compared with 2000, reflecting the progress of population aging on nationwide. (Fig. 3)
- The ratio of population aged under 15 years old to the total population decreased in all prefectures compared with 2000. As a result, the population aged 65 years old and over had become larger those aged under 15 years old in all prefectures except for Okinawa-ken.
The ratio of population aged under 15 years old rose in a total of 117 Shi, Machi and Mura, and 5.3% of the total number of them.
Note:The total number of Shi, Machi and Mura was 2,217 (as of October 1, 2005). The Ku-area of Tokyo was counted as one Shi.
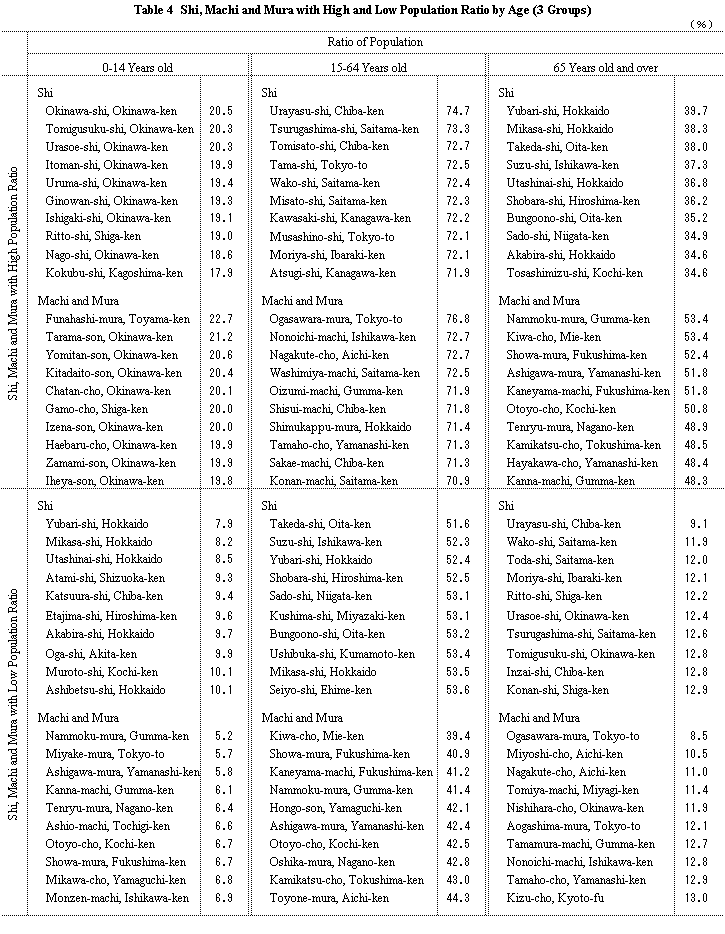
- As for the ratio of population aged under 15 years old by Shi, Okinawa-shi, Okinawa-ken had the highest ratio at 20.5%, while Yubari-shi, Hokkaido had the lowest ratio at 7.9%. The difference had narrowed from 13.2 percentage points in 2000 to 12.6 percentage points in 2005. By Machi and Mura, Funahashi-mura, Toyama-ken had the highest ratio at 22.7%, while Nammoku-mura, Gumma-ken had the lowest at 5.2%. The difference had narrowed from 20.3 percentage points in 2000 to 17.5 percentage points in 2005. (Table 4)
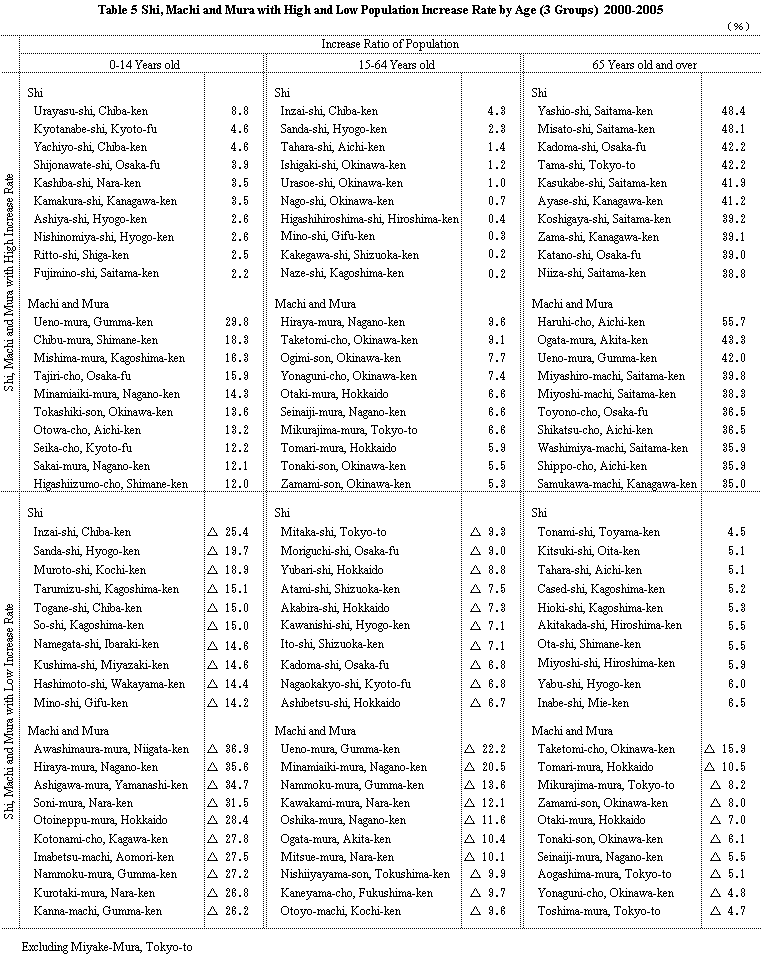
- The ratio of population aged under 15 years old rose in 2000-2005 in a total of 117 Shi, Machi and Mura, and 5.3% of the total number of them. Urayasu-shi, Chiba-ken had the highest increase rate among Shi at 8.8%, and Ueno-mura, Gumma-ken had the highest increase rate among Machi and Mura at 29.8%. (Table 5)
The ratio of population aged 65 years old and over rose in a total of 2,199 Shi, Machi and Mura, and 99.2% of the total number of them.
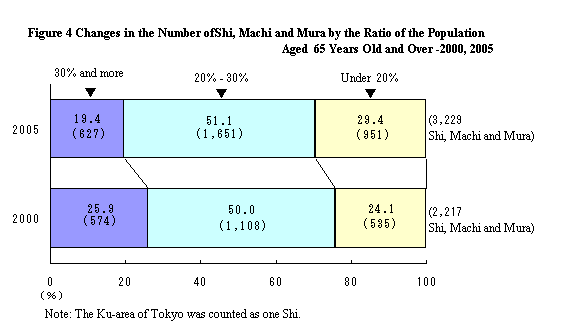
- As for the ratio of population aged 65 years old and over by Shi, Yubari-shi, Hokkaido had the highest ratio at 39.7%, while Urayasu-shi, Chiba-ken had lowest at 9.1%. The difference had expanded from 26.5 percentage points in 2000 to 30.6 percentage points in 2005. By Machi and Mura, Nammoku-mura, Gumma-ken had the highest ratio at 53.4%, while Ogasawara-mura, Tokyo-to had the lowest at 8.5%. The difference had also expanded from 42.5 percentage points in 2000 to 44.9 percentage points in 2005. (Fig. 4, Table 4)
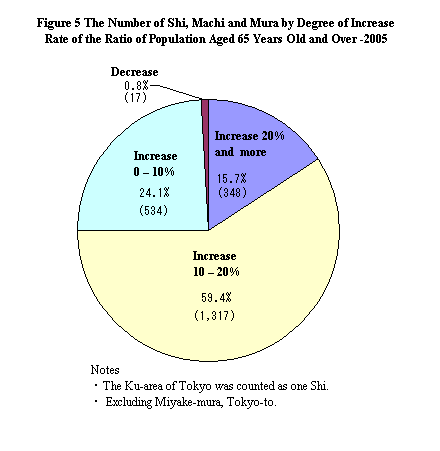
- The ratio of population aged 65 years old and over rose in 2000-2005 in a total of 2,199 Shi, Machi and Mura, and 99.2% of the total number of them. Yashio-shi, Saitama-ken had the highest rate among Shi at 48.4%, and Haruhi-cho, Aichi-ken had the highest increase rate among Machi and Mura at 55.7%. (Fig. 5, Table 5)
![]()
![]()