Main contents start here
News Bulletin
RECENT RELEASE
Highlights from the Results of the 2012 Economic Census for Business Activity
The 2012 Economic Census for Business Activity was conducted for the first time as of February 1, 2012. It is Japan's only statistical survey designed to ascertain accounting items (e.g. sales [income] and expenses) relating to all industries in Japan at the same point in time.
On August 27, 2013, the Ministry of Internal Affairs and Communications (MIC) and the Ministry of Economy, Trade and Industry (METI) released the final data on tabulations across industries (basic edition) as well as tabulations for individual industries (mining and quarrying of stone and gravel, and manufacturing industries) from the Census.
The following are the highlights of the Census results.
Tabulations across industries (basic edition):
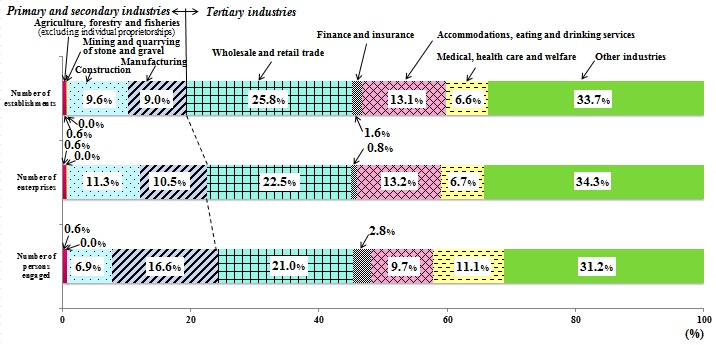
i. Situation of number of establishments, enterprises, and persons engaged
- The number of establishments was 5,768,489, the number of enterprises was 4,128,215, and the number of persons engaged was 55.837 million as of February 1, 2012.
- Looking at the number of establishments, enterprises, and persons engaged by industrial division, "wholesale and retail trade" was the largest and accounted for more than 20% of all industries.
Fig.1 The Composition ratios of number of establishments, enterprises, and persons engaged by industrial division
ii. Situation of amount of sales (income) and added value
- The amount of sales (income) and that of added value for enterprises in 2011 were 1.336 quadrillion yen and 244.762 trillion yen, respectively.
- As for the amount of added value by industrial division, "manufacturing" was the largest and accounted for more than 20% of all industries, followed by "wholesale and retail trade" accounting for a slightly less than 20% of all industries.
- Looking at the amount of added value by primary, secondary, and tertiary industries, the tertiary industries including "wholesale and retail trade" and "medical, health care and welfare" accounted for more than 70% of all industries.
Fig.2 The Composition ratios of sales (income) and added value by industrial division
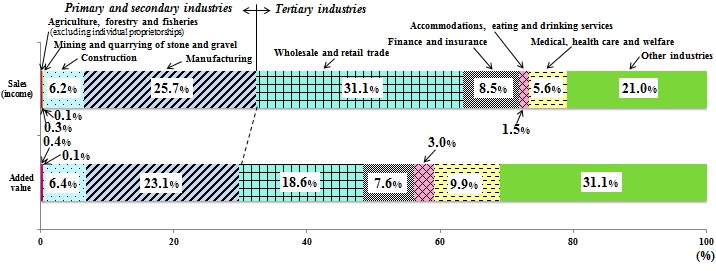
Note: "Other industries" refers to the total of "electricity, gas, heat supply and water," "information and communications," "transport and postal activities," "real estate and goods rental and leasing," "scientific research, and professional and technical services," "living-related and personal services, and amusement services," "education, learning support," "compound services," and "services, n.e.c." as defined by the Division of Japan Standard Industial Classification.
Tabulations for individual industries (mining and quarrying of stone and gravel industry):
- Regarding the "mining and quarrying of stone and gravel industry," the numbers for establishments and persons engaged were 2,286 and 21,427, respectively. In addition, the amount of sales (income), production sales, costs regarding mining activities, and added value were 571.0, 432.6, 215.5, and 217.1 billion yen, respectively.
Tabulations for individual industries (manufacturing industry):
- Commodity edition: Looking at the value of manufactured goods shipments for each commodity, the amount was the largest for "ordinary passenger cars, 2,000ml cylinder capacity or more, including chassis," followed by "medical products preparations, including preparations outside medicines," "gasoline," "parts of driving, transmission and operating units," "motor vehicle parts and accessories, including motorcycles," resulting in the commodities related to transportation equipment accounting for the top of the shipment value category.
- Industry edition: As for the "manufacturing industry" with 10 or more persons engaged, the numbers for establishments and persons engaged were 120,723 and 6,807,864, respectively. In addition, the value of manufactured goods shipments and added value were 276.567 and 87.442 trillion yen, respectively.
Future schedules for releasing data
February 2014
The tabulations across industries (Tabulation of each establishment status [continued / newly established / closed] edition) and for individual industries (service industries, medical, healthcare and welfare, and school education, etc.) will be released.
For details, see the website below.
http://www.stat.go.jp/english/data/e-census/2012/pdf/schedule.pdf(36KB)
Note: The survey was conducted for all establishments and enterprises except following establishments: individual proprietorships that fall under "agriculture, forestry and fisheries," "domestic services, " "foreign governments and international agencies in Japan," and "national and local public entities."
(Source) 2012 Economic Census for Business Activity (MIC and METI)
For more information, visit the "2012 Economic Census for Business Activity" website.
http://www.stat.go.jp/english/data/e-census/2012/index.htm
![]()
![]()
![]()
Some of the publications on this site are in PDF. To view them you will need to have Adove Acroabt Reader. Please click the graphic link to download Acrobat Reader.