Main contents start here
News Bulletin
RECENT RELEASE
The number of persons engaged in work decreased, and the ratio of "non-regular employees" reached record levels in 2012 - The result of the 2012 Employment Status Survey -
[Introduction]
The number of "persons engaged in work" decreased by 1.557 million in the past 5 years. The ratio of "non-regular employees" among employees (excluding executives) was 38.2%, and it reached record levels in 2012.
This is shown by the result of the 2012 Employment Status Survey which was released on July 12, 2013 by the SBJ. This survey aims to obtain basic data on the actual conditions of the employment structure at both national and regional levels by surveying the usual labour force status in Japan.
[Summary]
Labour force status of the population of 15 years old and over
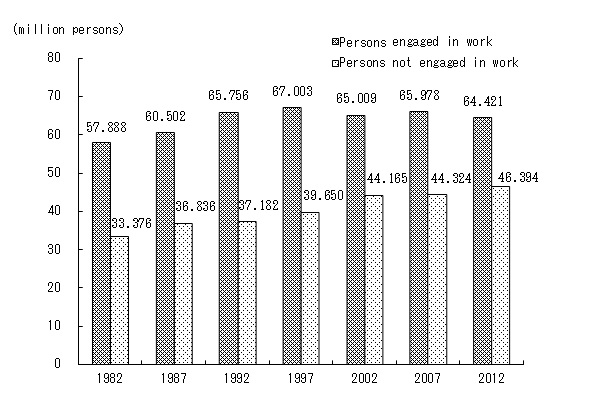
The population aged 15 years old and over was 110.815 million, as of 1 October, 2012. The number of persons engaged in work was 64.421 million, while that of persons not engaged in work was 46.394 million.
The number of those engaged in work decreased by 1.557 million (2.4%) and those not engaged in work increased by 2.070 million (4.7%), compared with 2007.
Fig.1 "Number of persons engaged in work" and "Number of persons not engaged in work" / 1982-2012
Percentage of persons engaged in work
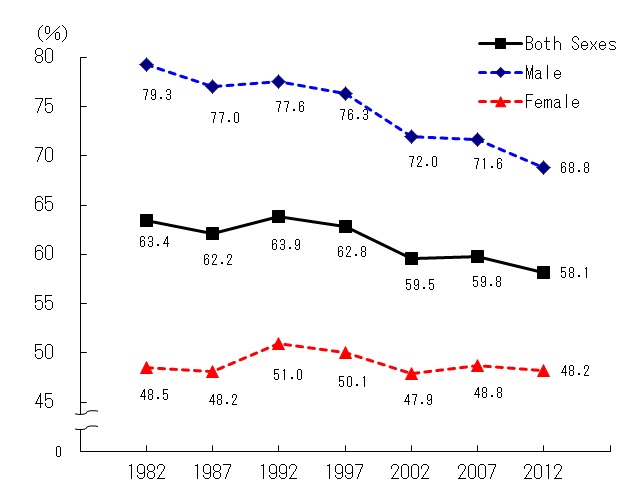
The percentage of population aged 15 years old and over who were engaged in work (Percentage of persons engaged in work) was 58.1%, a decrease by 1.7 points compared with 2007.
An analysis by gender shows that the ratio was 68.8% for males and 48.2% for females, meaning a drop by 2.8 points for males and 0.6 points for females compared with 2007.
Looking at the trends in those since 1982, there has been a decline for males, falling below 70% for the first time in 2012. When looking at females we can see an increase in 1992 and 2007, but 2012 showed a decrease again.
Fig.2 Trends in the ratio of persons engaged in work, by gender / 1982-2012
Non-regular employees
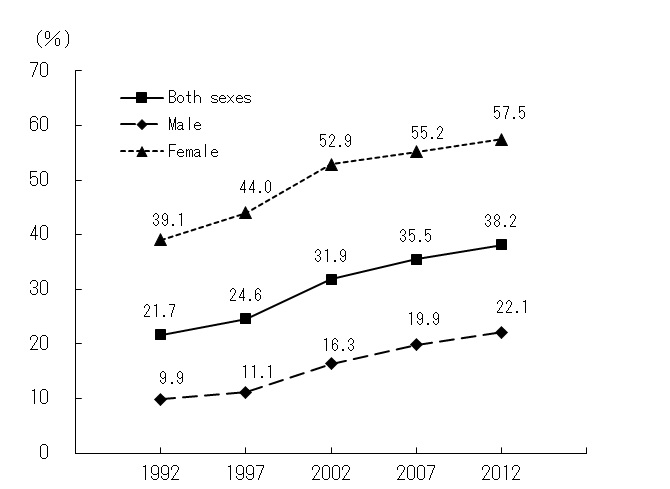
Looking at the trend in the ratio of "Part-time workers", "Arbeit (temporary workers)" and other "non-regular employees" among employees (excluding executives), it is obvious the level has risen continuously from 21.7% in 1992, and reached a record 38.2% in 2012.
An analysis by gender shows similar trends for both genders, especially for females, which has risen continuously from 39.1% to 57.5%, and the ratio of "non-regular employees" has accounted for more than 50% ever since breaching that mark in 2002.
Fig.3 Trends in the ratio of non-regular employees among employees (excluding executives) by gender / 1992-2012
Labour aftermath of the Great East Japan Earthquake
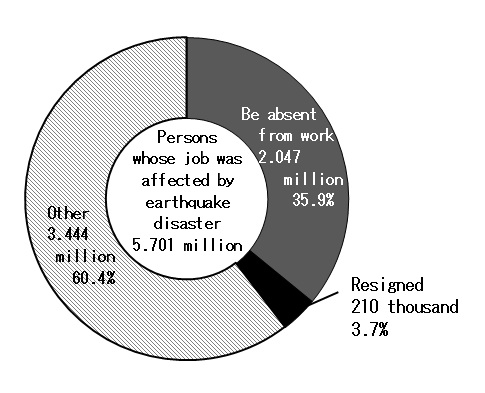
The number of the persons whose job was affected (be obliged to resign or be absent from work and so on) by the Great East Japan Earthquake reached 5.701 million.
By prefecture, that was 1.139 million in the three disaster-affected prefectures (Iwate, Miyagi and Fukushima, the same shall apply hereafter), and 4.562 million in other prefectures.
The number of the persons who was obliged to resign reached 210 thousand, 86 thousand in the three disaster-affected prefectures and 125 thousand in other prefectures, which means that more than 40% of those lived in the three disaster-affected prefectures.
While the number of the persons who was obliged to be absent from work reached 2.047 million, 658 thousand in three disaster-affected prefectures and 1.389 million in other prefectures, meaning that more than 30% of those lived in three disaster-affected prefectures.
Fig.4 Number and percentage of persons whose job was affected by earthquake disaster / 2012
(Source) Employment Status Survey
The 2012 results were released on July 12, 2013.
For further survey information, see the website below.
http://www.stat.go.jp/english/data/shugyou/index.htm (URL)
![]()
![]()