Main contents start here
News Bulletin
RECENT RELEASE
First Results from the 2012 Economic Census for Business Activity Released
On January 29, 2013, the SBJ and the Ministry of Economy, Trade and Industry (METI) released the preliminary results from the 2012 Economic Census for Business Activity.
The Economic Census for Business Activity, the only survey to comprehensively find out accounting items such as sales (income) and expenses across all industries at the same point in time, was conducted for the first time as of February 1, 2012. The objectives of the Census are to identify the economic situation of establishments and enterprises in all industries on a national and regional level, and to obtain basic information for conducting various statistical surveys.
This preliminary data shows number of establishments, number of enterprises, number of employees, sales (income), added value and other items by industry division based on the Japan Standard Industrial Classification.
Overview:
- The number of establishments was 5.804 million (decreased 6.4% compared to the result of the 2009 Economic Census for Business Frame), and the number of enterprises was 4.097 million (decreased 8.6%), and the number of employees was 56.324 million (decreased 3.6%) as of February 1, 2012.
- The total amount of sales (income) of enterprises was 1.302 quadrillion yen, and the total amount of added value was 242.666 trillion yen in 2011.
Other Findings:
- When broken down by industry, "Wholesale and Retail Trade" was the largest number of establishments with 1.427 million (26.0% of all industries), followed by "Accommodations, eating and drinking services" with 0.711 million (13.0%) and "Construction" with 0.527 million (9.6%). These three industries were a little under 50% of all industries, and the tertiary sector (service sector) covered 80.6% of all industries.
- The number of employees by industry was the largest also in "Wholesale and Retail Trade" with 11.984 million (21.3% of all industries), followed by "Manufacturing" with 9.422 million (16.7%) and "Medical, Health Care and Welfare" with 6.254 million (11.1%). These three industries were a little under 50% of all industries, and the tertiary sector engaged 75.6% of all employees.
The composition ratios of number of establishments and employees by industry division
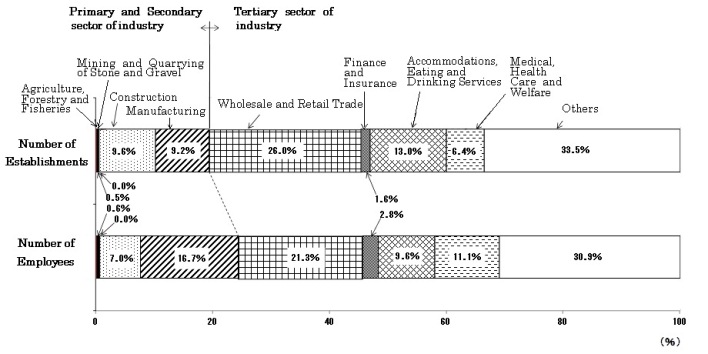
"Others" Includes "Electricity, Gas, Heat Supply and Water", "Information and Communications", "Transport and Postal Activities",
"Real Estate and Goods Rental and Leasing", "Scientific Research, Professional and Technical Services", "Living-Related and
Personal Services and Amusement Services", "Education, Learning Support", "Compound Services" and " Services, N.E.C.".
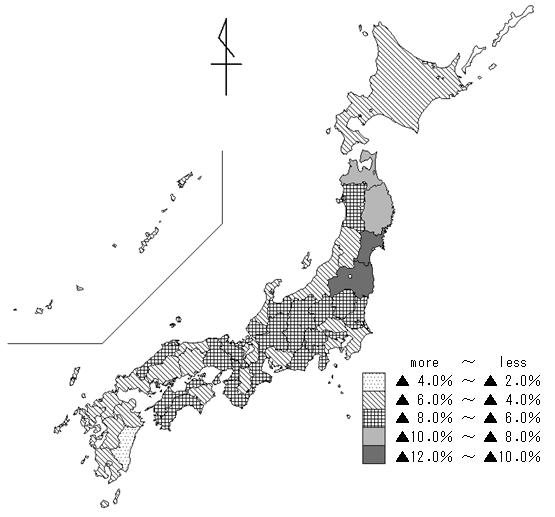
- By prefectures, Tokyo had the largest number of establishments with 707.298 thousand (12.2% of all prefectures), followed by Osaka with 445.702 thousand (7.7%) and Aichi with 333.599 thousand (5.7%). Compared to the result of the 2009 Economic Census for Business Frame, Fukushima (decreased 11.2%), Miyagi (decreased 11.0%) and Iwate (decreased 9.1%) , the prefectures severely affected by the Great East Japan Earthquake, were the three prefectures which showed the highest rate of decline.
The number of establishments change rate by prefectures (compared to 2009 Economic Census)
- Regarding sales, "Wholesale and Retail Trade" had the highest with 400.304 trillion (30.7% of all industries), followed by "Manufacturing" with 342.443 trillion (26.3%) and "Finance and Insurance" with 110.516 trillion (8.5%). These three industries covered more than 60% of total amount of sales.
- As for added value, "Manufacturing" was the highest with 53.261 trillion (21.9% of all industries), followed by "Wholesale and Retail Trade" with 42.348 trillion (17.5%) and "Finance and Insurance" with 31.288 trillion (12.9%). These three industries covered more than 50% of total amount of added value, and the tertiary sector covered 71.8% of total amount of added value.
The composition ratios of sales (income) and added value by industry division - 2011
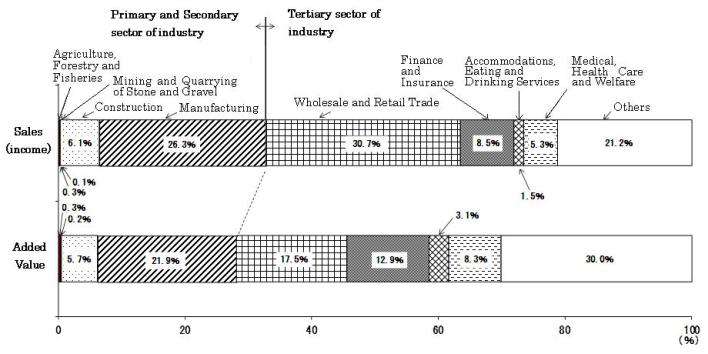
"Others" Includes "Electricity, Gas, Heat Supply and Water", "Information and Communications", "Transport and Postal Activities",
"Real Estate and Goods Rental and Leasing", "Scientific Research, Professional and Technical Services", "Living-Related and
Personal Services and Amusement Services", "Education, Learning Support", "Compound Services" and " Services, N.E.C.".
[Notes]
These preliminary data are subject to change; they will be superseded by final data released after August 2013.
This survey conducted for all establishments and enterprises except following establishments: Individual proprietorships which belonged to "Agriculture, Forestry and Fisheries", Domestic Services, Foreign Governments and International Agencies in Japan, National and Local Government.
(Source)2012 Economic Census for Business Activity (SBJ and METI)
The 2012 preliminary data were released on January 29, 2013. For further information about the 2012 Economic Census for Business Activity, see the following website.
http://www.stat.go.jp/english/data/e-census/2012/index.htm
![]()
![]()