Main contents start here
News Bulletin
RECENT RELEASE
2011 Family Income and Expenditure Survey shows decrease in consumption expenditure in real terms
The 2011 yearly averages of the Family Income and Expenditure Survey (total households) were released in February 2012 by the SBJ. This survey is a sample survey with about 9,000 households randomly selected from all households in Japan. It has been conducted to reveal the actual conditions of family income and expenditure. The SBJ releases the results of "Income and Expenditure" and "Savings and Liabilities", and this report introduces the results of "Income and Expenditure".
The yearly average of monthly consumption expenditure per household was 247,219 yen, down by 2.0% in nominal terms and down by 1.7% in real terms from the previous year. Real terms figures show the first decrease since 2009. The yearly average of monthly consumption expenditure of workers' households*1) decreased by 2.6% in nominal terms and decreased by 2.3% in real terms.
*1) "Workers' households" refers to households whose heads are employees in both private or public sectors, such as private companies, factories, schools, hospitals, shops, government offices, etc. Households whose heads are executive officers such as presidents, directors and commissioners of companies are classified as "Other Households".
The yearly average of monthly income per workers' household was 462,199 yen, down by 2.0% in nominal terms and down by 1.7% in real terms from the previous year. Among income categories, the regular income of household heads decreased by 1.1% in real terms, and temporary incomes and bonuses decreased by 4.1% in real terms.
Among expenditure for goods*2) and services, average spending on goods decreased by 1.9% in real terms from the previous year. A further breakdown of expenditure reveals that spending on durable goods decreased by 9.1% in real terms, spending on semi-durable goods decreased by 0.4% in real terms and non-durable goods decreased by 1.3% in real terms. The strong decrease in durable goods was mainly caused by the substantial decrease in the expenditure for recreational durable goods such as TV sets. Spending on services decreased by 1.1% in real terms.
*2) "Goods" are divided into the following three categories.
"Durable goods"???Goods which have an expected lifespan of one year or more, and whose prices are comparatively expensive.
"Semi-durable goods"???Goods which have an expected lifespan of one year or more, but whose prices are less expensive than "Durable goods"
"Non-durable goods"???Goods which have an expected lifespan of less than one year.
Changes in Consumption Expenditures from the Previous Year
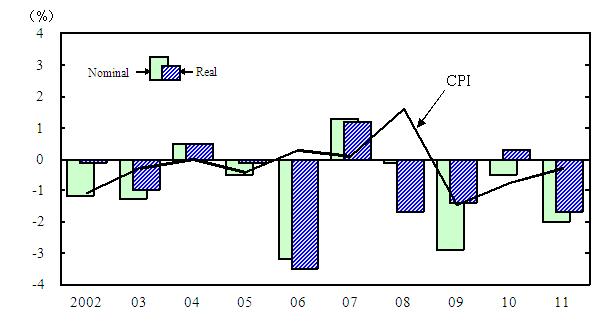
(Source)Family Income and Expenditure Survey(SBJ)
The annual average figures in 2011 were released on February 17, 2012. For further details, see the website below.
http://www.stat.go.jp/english/data/kakei/index.htm
![]()
![]()