Main contents start here
News Bulletin
RECENT RELEASE
Preliminary Sample Tabulation of the 2010 Population Census of Japan released
The Preliminary Sample Tabulation of the 2010 Population Census was released on June 29, 2011.
The tabulation using sample households was carried out to offer preliminary results on the basic characteristics of the population and households including sex, age, labour force status, industrial and occupational structure, place of work or schooling. The sampling ratio for this tabulation was about one percent.
[Population]
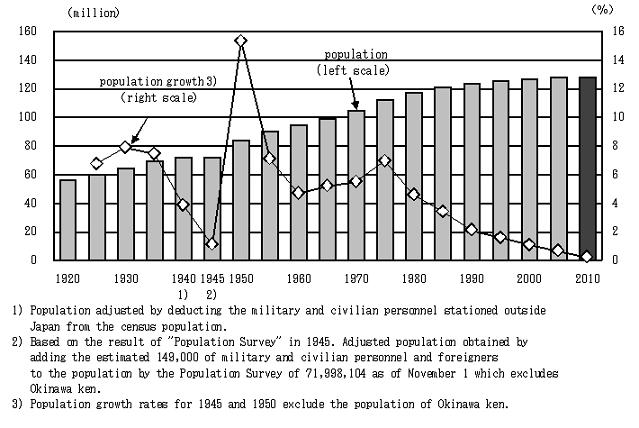
The population of Japan is 128,056 thousand as of October 1, 2010, remaining at virtually the same level as 2005.
The population of Japan remained at virtually the same level - increasing only 0.2% from 2005, or 0.05% on an annual basis. This is the lowest increase rate since the Population Census started in 1920.
Broken down by sex, the male population numbered 62,501 thousand (48.8% of the total population) and the females numbered 65,555 thousand (51.2%).
The Japanese population stood at 125,692 thousand, remaining almost at the same level as 2005.
Population and population growth rate -Japan: 1920 to 2010
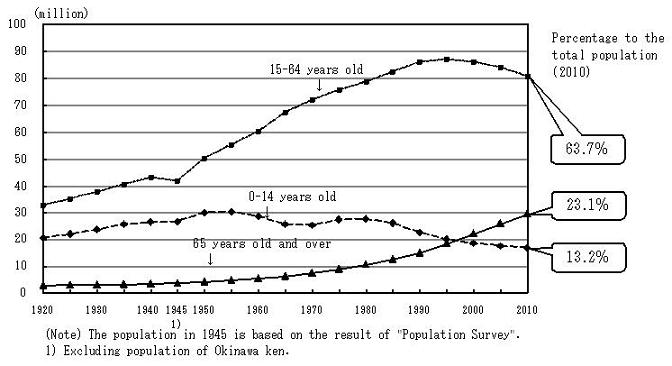
The percentage of the population aged 65 and over increased from 20.2% to 23.1%.
The population under 15 years old was 16,798 thousand (13.2% of the total population), those aged 15 to 64 totaled 80,730 thousand (63.7%) and those aged 65 years old and over numbered 29,293 thousand (23.1%).
The population aged under 15 years old decreased by 724 thousand (4.1%) from 2005, and those aged 15 to 64 years old decreased by 3,362 thousand (4.0%).
The population aged 65 years old and over increased by 3,621 thousand (14.1%).
Change of population composition by age group-Japan: 1920 to 2010
The percentage of the population aged 65 years old and over is the highest in the world.
The percentage of the population aged 65 years old and over in Japan is 23.1%, which is the highest in the world, followed by Germany and Italy both at 20.4%.
Percentage of population aged 65 years old and over: 1950 to 2010
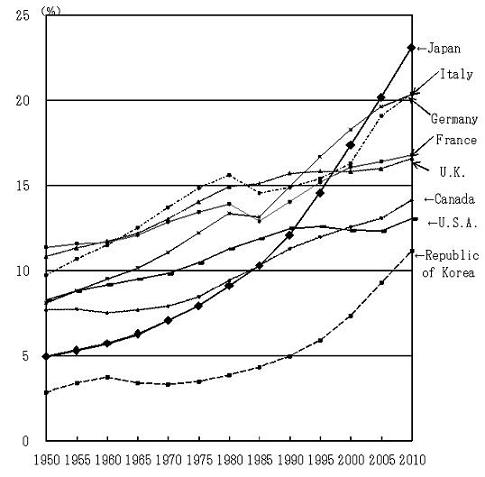
Source: United Nations, "World Population Prospects, The 2010 Revision"
2010 Population Census (Statistics Bureau of Japan)
[Employed persons]
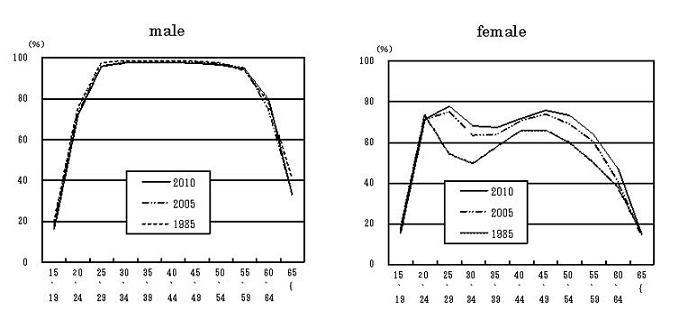
The labour force participation rate among males decreased consecutively, while the rate among females increased.
The labour force participation rate among 15 year-old and over (110,024 thousand) was 60.7%, down by 0.8 points from 2005.
The rate for males was 73.4%, down by 1.9 points from 2005 while the rate among females was 49.1%, up by 0.3 points.
The rate for females aged 30 to 34 was 68.2%, and the bottom of the M-shaped curve shifted from the 30 to 34 years old age group to the 35 to 39 years old one (67.3%).
Labour force participation rate by age (five-year groups) and sex -Japan: 1985, 2005 and 2010
The percentage of "Medical, health care and welfare" exceeded 10%, a 1.9 points increase.
Regarding the percentage of employed persons aged 15 and over by industry (major groups), "Wholesale and retail trade" was the biggest at 17.0%, followed by "Manufacturing" at 16.3% and "Medical, health care and welfare" at 10.6%.
In particular, "Medical, health care and welfare" went up by 1.9 points from 2005.
The composition ratios of the employed persons aged 15 and over by industry (major groups) -Japan: 1995 to 2010
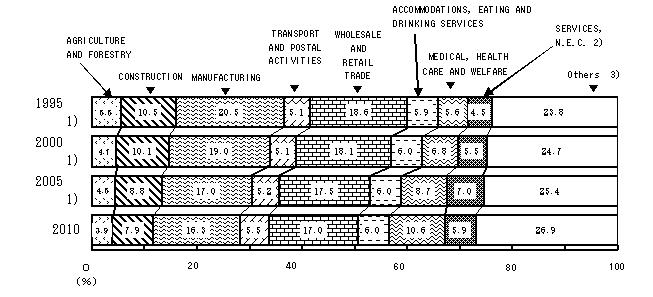
1) In 2010 "Temporary employees" were included in respective industries to which they are dispatched, but during 1995 to 2005, included in the industrial classification of "Worker dispatching services".
2) Including "Fisheries", "Mining and quarrying of stone and gravel", "Electricity, gas, heat supply and water", "Information and communications", "Finance and insurance", "Real estate and goods rental and leasing", "Scientific research, professional and technical services", "Living-related and personal services and amusement services", "Education, learning support", "Compound services", "Government, except elsewhere classified" and "Industries unable to classify".
[Households]
The number of one-person households was 15,885 thousand, the largest category, and exceeded 30% among private households.
The number of private households was 50,928 thousand, and exceeded 50,000 thousand for the first time since the Population Census of Japan started (1920).
The number of one-person households was 15,885 thousand and formed the largest category among private households.
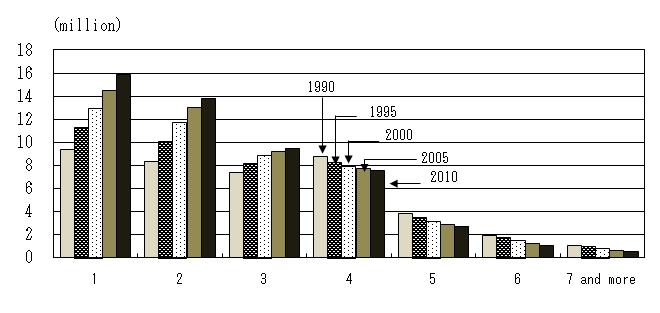
Larger households are much less numerous than smaller ones.
The number of three-person or fewer households increased, but the number of four-person and over households decreased.
Private households by size of households-Japan: 1990 to 2010
In the population aged 65 and over, one in 10 males and one in 5 females were living alone.
The percentage of "aged-single-person" to the population aged 65 years old and over had risen - those aged 65 years old and over were 10.4% for males and 19.5% for females, indicating the fact that one out of 10 males and one out of 5 females were living alone.
The number of people who live as "Inmates of social institutions" was 1,215 thousand. This is approximately 1.5 times the number of 2005.
The number of the population aged 65 and over by type of households and sex -Japan: 1995 to 2010
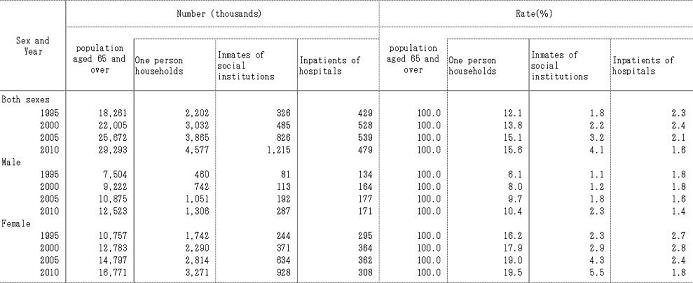
Ratios are calculated without "unknown".
(Source) Population Census (SBJ)
For further details, see the website below.
http://www.stat.go.jp/english/data/kokusei/index.htm
![]()
![]()