Main contents start here
News Bulletin
RECENT RELEASE
The Total Sales of Service Industries in 2010 Decreased by 2.2%
[Introduction]
The Monthly Survey on Service Industries has been conducted since October 2008 to improve the accuracy of current economic statistics such as Quarterly Estimates (QE) of GDP, by grasping the monthly sales (income) and number of persons working for major service industries.
On May 31, 2011, the SBJ released the annual report of the 2010 Monthly Survey on Service Industries.
[Summary]
1. Sales
The total sales of service industries in 2010 decreased by 2.2% to 284 trillion yen, compared with the previous year.
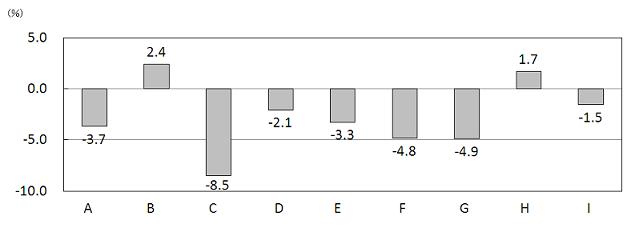
By industry, sales decreased in 7 industries, such as "Real estate and goods rental and leasing" (31.4 trillion, a decrease of 8.5%), "Education, learning support" (3.5 trillion, a decrease of 4.9%). On the other hand, two industries showed an increase in sales. These industries were "Transport and postal activities" (47.8 trillion, an increase of 2.4%) and "Medical, health care and welfare" (42.9 trillion, an increase of 1.7%).
Figure1 The Total Sales(Income) by Industry (Over the Previous Year)
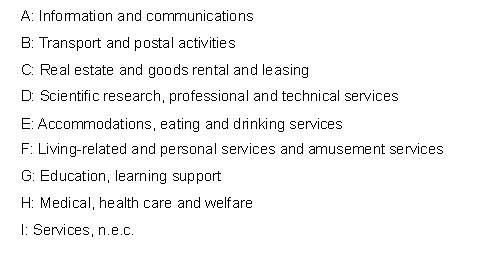
2. Change in Monthly Sales
The total monthly sales decreased consistently throughout 2010, compared with the same month a year before.
Figure2 Change in Monthly Sales
3. Number of Persons Working
When compared with the year before, the number of persons working (annual average) decreased by 1.0% to 26.13 million persons, compared with the previous year.
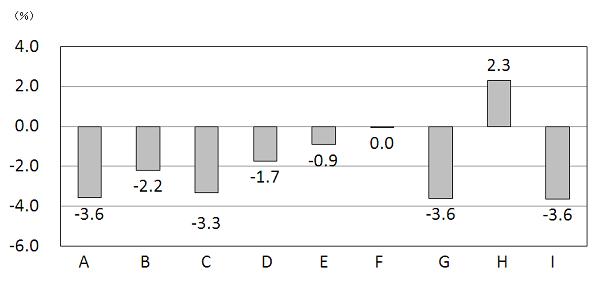
By industry, the number of persons working decreased in 7 industries, such as "Services, n.e.c." (2.91 million persons a decrease of 3.6%), "Education, learning support" (0.98 million persons a decrease of 3.6%) and "Information and communications" (2.78 million persons a decrease of 3.6%). On the other hand, the number of persons working increased in "Medical, health care and welfare" (6.43 million persons an increase of 2.3%).
Figure3 The Number of Persons Working (2010 Annual Average) by Industry (compared with the same month a year before)
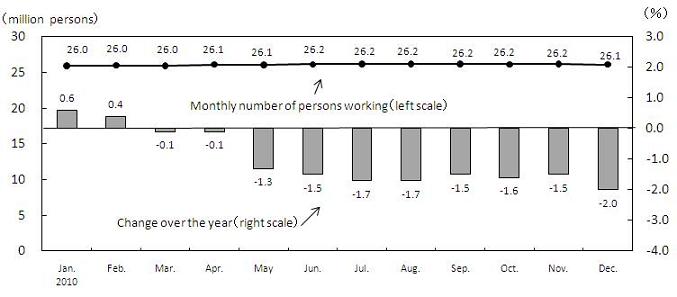
4. Change in Monthly Number of Persons Working
The monthly number of persons working in 2010 increased in January and February, however, it decreased consistently after March, compared with the same month in the previous year.
Figure4 Change in the Monthly Number of Persons Working
(Source) Monthly Survey on Service Industries (SBJ)
For further details, see the website below.
http://www.stat.go.jp/english/data/mssi/index.htm
![]()
![]()