Main contents start here
News Bulletin
RECENT RELEASE
Household assets decreased between 2004 and 2009 - The 2009 National Survey of Family Income and Expenditure -
[Introduction]
Household assets of multi-person households in 2009 decreased by 6.2% compared with 5 years before. This is shown by the results of the 2009 National Survey of Family Income and Expenditure (NSFIE)*1), which was released on March 31, 2011 by the SBJ. The results covered "Household Assets". The survey has been conducted every five years since 1959 to grasp the overall structure of the household economy.
*1) The results of the 2009 NSFIE were released according to the following schedule: the results on "major durable goods" on July 30, 2010, the results on "family income and expenditure" and "savings and liabilities" (one-person households) on September 30, 2010, the results on "family income and expenditure" and "savings and liabilities" (multi-person households) on December 24, 2010 and the results on "household assets" on March 31, 2011.
[Summary]
Household assets of multi-person households
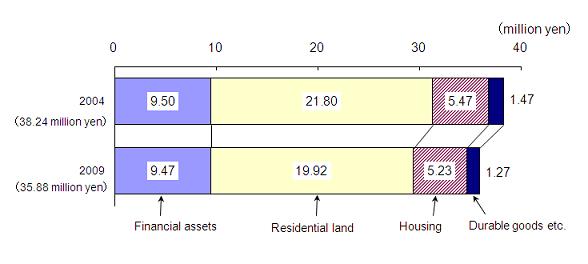
Average household assets (net asset value) of multi-person households totaled 35.88 million yen. Among the various types of assets, residential land accounted for the largest part, at 19.92 million yen or 55.5% of total household assets. This was followed by financial assets (outstanding savings minus liabilities) at 9.47 million yen, then housing at 5.23 million yen and finally durable goods etc. with an estimated value of 1.27 million yen.
Compared with the 2004 survey, total assets dropped by 6.2%. This is mainly due to the large decrease in the value of residential land and housing.
Figure 1 Changes in Household Assets (Multi-person Households)
Distribution of households by size of assets
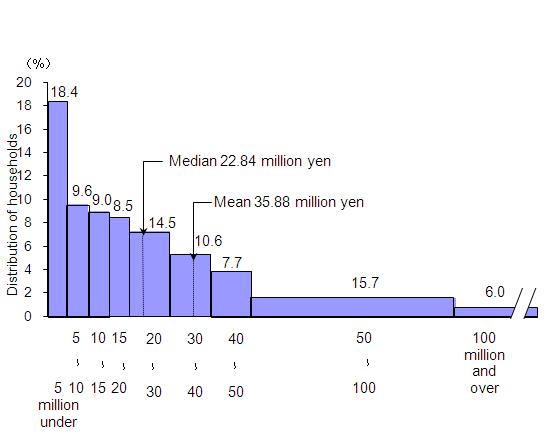
The distribution of households by asset size in multi-person households showed that households with total assets below the average (35.88 million yen) accounted for 66.2% of total households. This indicates the asset distribution is skewed toward smaller asset sizes. The median amount of assets was 22.84 million yen.
Figure 2 Distribution of Households by Size of Assets (Multi-person Households)
Household Assets of One-person Households
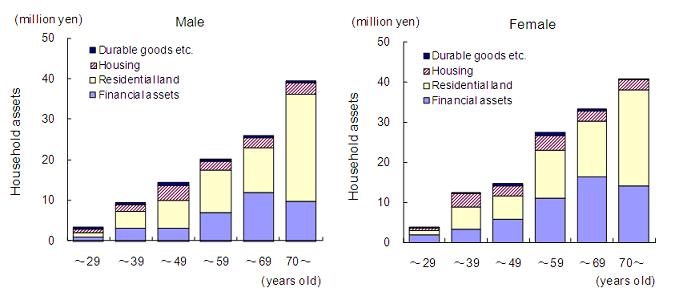
The average amount of household assets of one-person households was higher in higher age groups for both males and females. The average amount of assets of 29.97 million yen for females was higher than that of 18.61 million for males.
Figure 3 Average Household Assets by Age and Sex (One-person Households)
Household Assets of Multi-person Households by Prefecture
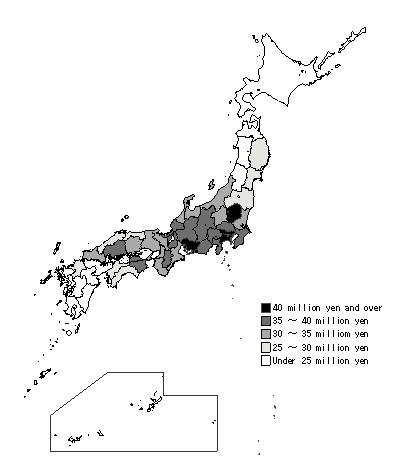
In Tokyo, the average amount of household assets of multi-person households was 59.09 million yen, the largest amount among all prefectures, followed by Kanagawa-ken, Aichi-ken and Tochigi-ken. The households which have a large amount of assets were concentrated mainly in the Kanto region.
On the other hand, the average amount in Hokkaido was 18.12 million yen, the least amount among all prefectures, followed by Aomori-ken, Kagoshima-ken and Okinawa-ken. The households which have a small amount of assets were concentrated in the Hokkaido and Kyushu region.
Figure 4 Average Household Assets by Prefecture (Multi-person Households)
For the information about prefecture name, please check the following URL.
http://www.stat.go.jp/english/data/handbook/pdf/shjmap_a.pdf(Source) 2009 National Survey of Family Income and Expenditure (SBJ)
For further details, see the website below.
http://www.stat.go.jp/english/data/zensho/index.htm
![]()
![]()