Main contents start here
News Bulletin
RECENT RELEASE
Living expenditures, savings and liabilities decreased in 2009 - The 2009 National Survey of Family Income and Expenditure -
[Introduction]
Living expenditures dropped by 6.0% on a nominal basis in 2009. At the same time liabilities decreased by 7.0%, and savings by 2.2%. Families are also increasingly turning to discount stores, mass-sale speciality stores for their shopping.
This is shown by the results of the 2009 National Survey of Family Income and Expenditure (NSFIE)*1), which were released on December 24, 2010 by the SBJ. The results covered "Family income and Expenditure" and "Savings and Liabilities" for multi-person households. The survey has been conducted every five years since 1959 to grasp the overall structure of the household economy.
*1) The results of the 2009 NSFIE was released in the following schedule: the result on "major durable goods" on July 30, 2010, the result on "family income and expenditure" and "savings and liabilities" (one-person households) on September 30, 2010. In March, 2011, the result on "household assets" will be released.
[Summary]
Living expenditures of multi-person households
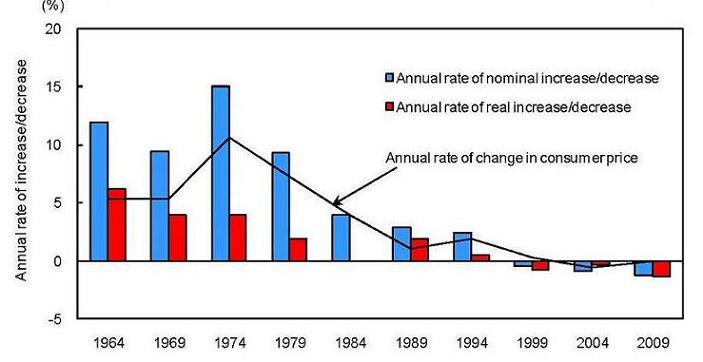
Living expenditures of multi-person households per month during the period from September through November 2009 (hereinafter referred to as the "monthly average") was 300,936 yen per household. This is a decline of 6.0% on a nominal basis (at an annual rate of 1.2%) and a drop of 6.1% on a real basis adjusted for the change in consumer prices (at an annual rate of 1.3%).
In 1999, living expenditures per household started to drop for the first time since the survey was begun in 1959 and this trend has remained so ever since.
Figure 1 Changes in Annual Rates of Increase/Decrease in Average Monthly Living Expenditures over Previous Survey (Multi-person Households)
Living expenditures by life stages
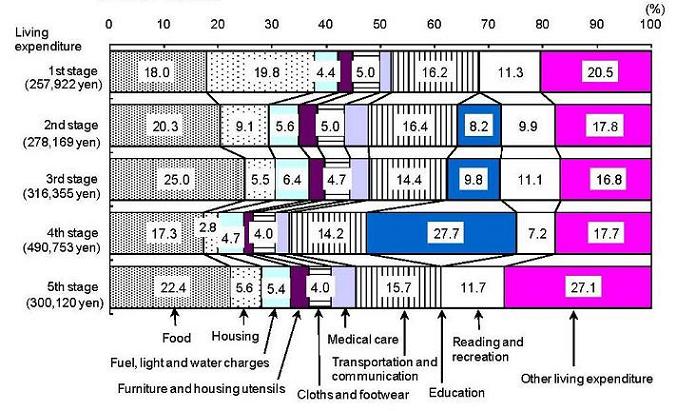
Life of workers' households*2) is categorized into five stages. The 1st stage refers to households comprised of married couples (the husband is under 30). The 2nd stage refers to households comprised of married couples with 2 children (the eldest child is at a preschool age). The 3rd stage is households comprised of married couples with 2 children (the eldest child is in junior high school). The 4th stage consists of households comprised of married couples with 2 children (the eldest child is in college); and the 5th stage is made up of households of married couples (the husband is 60 or older). There are distinct differences in living expenditures among these stages, especially remarkable in housing and education.
In the 1st stage, housing accounted for 19.8% of the total living expenditures and was much higher than later stages due to the low ratio of home-ownership. In later stages, housing expenditure drops as the percentage of home-ownership rises.
Starting from the second stage, education takes up an ever increasing share of household spending. It reaches a maximum at 27.7% in the 4th stage when families are supporting children going to universities. In the 5th, stage reading & recreation and "other living expenditures" including social expenses takes up the major part of family expenditure.
*2) "Workers' households" refers to households whose heads are wage earners employed by public or private sectors. The households whose heads are executive officers such as presidents, directors and commissioners, however, are classified as "other households".
Figure 2 Composition of Average Monthly Household Living Expenditures by Life Stage (Workers' Households)
Savings and liabilities
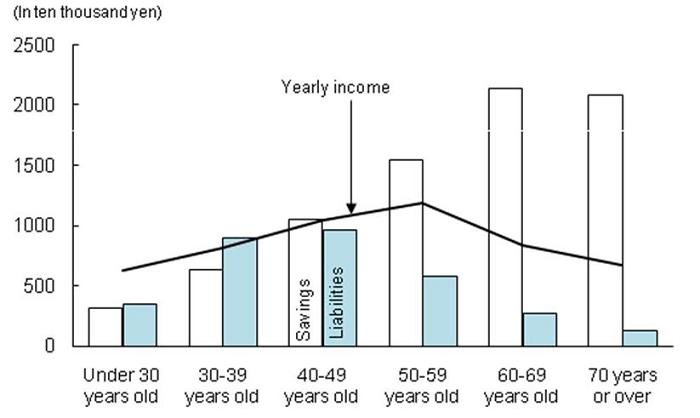
The amount of savings per household in multi-person households was 15.21million yen in 2009, down 2.2% compared with the 2004 survey. The amount of liabilities was 5.43 million yen per multi-person household, down 7.0% compared with the 2004 survey. Both of these figures showed the first decrease since the start of this survey. An analysis by age group shows that savings increase with age, reaching a maximum with households whose head is in his 60s. Households with heads over 70 have slightly lower saving rates, because they spend their savings after their retirement. Liabilities reach a maximum with households whose heads are in their 40s.
Figure 3 Changes in Savings and Liabilities (Multi-person Households)
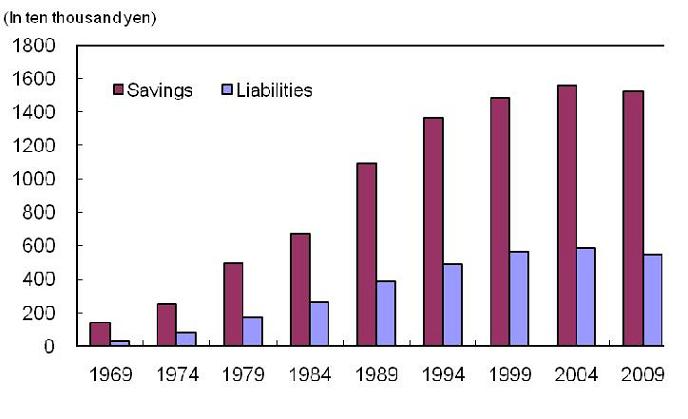
Figure 4 Savings and Liabilities by Age Group of Household Heads (Multi-person Households)
Living expenditures by shop type
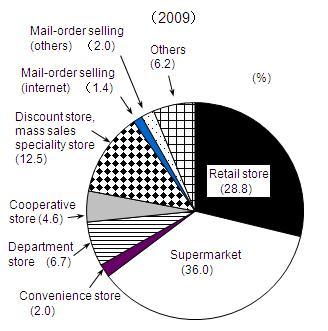
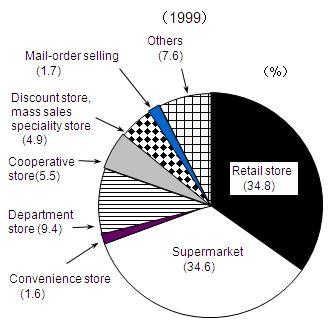
An analysis of where people purchase products shows that supermarkets accounted for the largest share with 36.0%. Compared with 1999, purchases at retail stores, department stores and cooperative stores declined. On the other hand, discount stores, mass-sale speciality store showed a strong increase.
Figure 5 Changes in shopping behaviour (Multi-person Households)
(Source) 2009 National Survey of Family Income and Expenditure(SBJ)
For further details, see the web site below.
http://www.stat.go.jp/english/data/zensho/index.htm
![]()
![]()