Main contents start here
News Bulletin
RECENT RELEASE
Annual Results of the 2009 Monthly Survey on Service Industries
[Introduction]
The Monthly Survey on Service Industries has been conducted since October 2008 to improve the accuracy of economic indicators such as Quarterly Estimates (QE) of GDP, by grasping the monthly sales (revenue) and number of employees*1) for major service industries.
This time, the SBJ released the annual results of the 2009 Monthly Survey on Service Industries. The summary is as follows.
*1) Number of employees is the number of persons working at the location of establishment on the last working day of the month. (Including those who work at the establishment as dispatched or subcontracted workers employed by other management, but excluding employees employed by the establishment but dispatched to a separately operated establishment.)
[Summary]
1. Sales
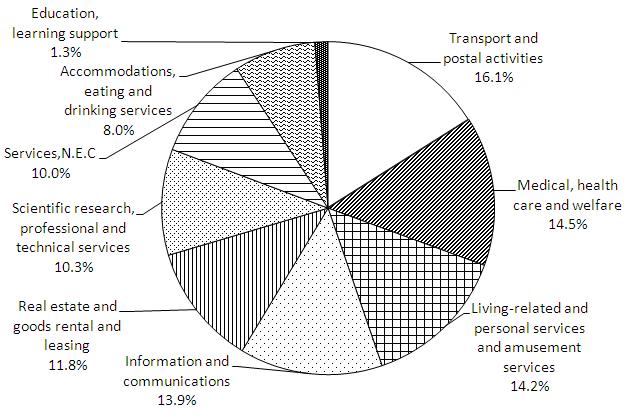
The total sales of service industries in 2009 was 290.5 trillion yen.
Regarding composition by industry, "Transport and postal activities" was the highest at 16.1% (46.7 trillion yen) and "Education, learning support" was the lowest at 1.3% (3.7 trillion yen) among the 9 industries.
Figure1 Composition of sales by industry (2009)
2. Sales per Establishment
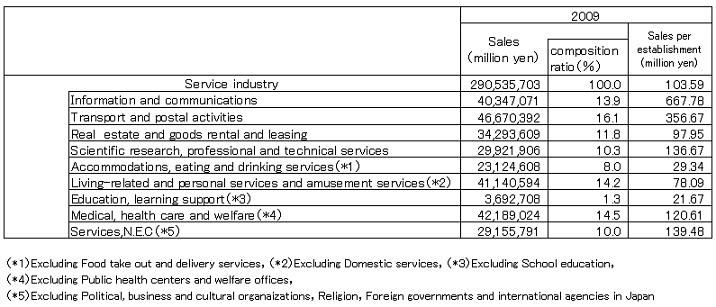
The total sales per establishment for the service industries in 2009 was 103.6 million yen.
By industry, "Information and communications" with 667.8 million yen was the highest among the 9 industries.
Table1 Sales and Sales per Establishment by industry (2009)
3. Number of Employees
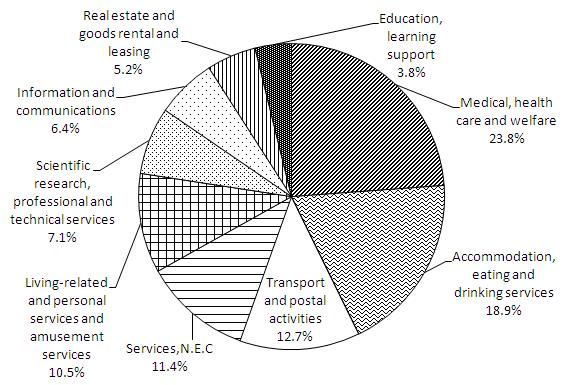
The number of employees was 26.4 million in 2009 (monthly average).
With regard to composition by industry, "Medical, health care and welfare" (23.8%, 6.3 million) was the highest, followed by "Accommodations, eating and drinking services industries" (18.9%, 5.0 million). These two industries accounted for nearly 40% of the total.
Figure2 Composition of number of employees by industry (2009)
4. Sales per Employees
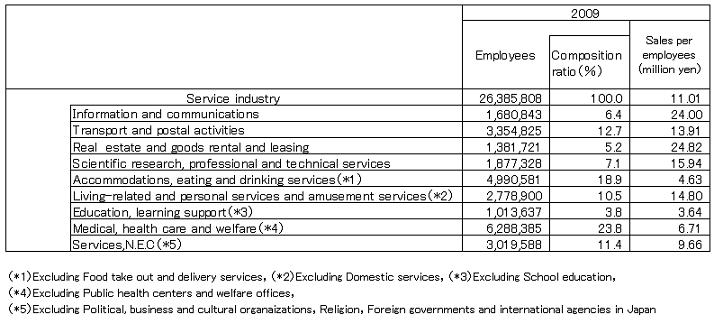
The sales per employees was 11.0 million yen in 2009.
By industry, "Real estate and goods rental and leasing" was the highest with 24.8 million yen. "Information and communications" was the second highest with 24.0 million yen.
Table2 Number of Employees and Sales per employees by industry (2009)
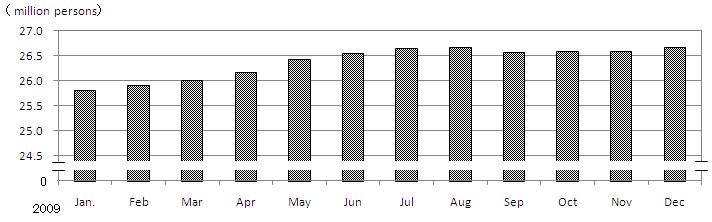
(Reference) Change in monthly sales and number of employees
Figure3 Change in Monthly Sales of Service Industries (2009)
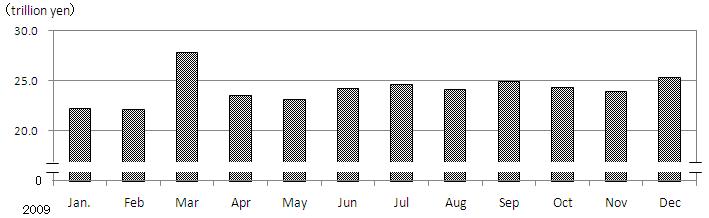
Figure4 Change in Number of Employees by Month (2009)
(Source) Monthly Survey on Service Industries (SBJ)
For further details, see the web site below.
http://www.stat.go.jp/english/data/mssi/index.htm
![]()
![]()