Main contents start here
News Bulletin
RECENT RELEASE
Release of the Results of Major Durable Goods Owned by Households - The 2009 National Survey of Family Income and Expenditure -
[Introduction]
The results of the 2009 National Survey of Family Income and Expenditure*1) were released on July 30, 2010 by the SBJ, regarding major durable goods owned. The survey has been conducted every five years since 1959 to grasp the overall structure of the household economy.
The summary of major durable goods owned is as follows.
*1) The National Survey of Family Income and Expenditure has surveyed "income and expenditures", "savings and liabilities", "major durable goods", and "household assets" such as "residences and residential property". Other results will also be released in series, later, regarding "household income and expenditures", "savings and liabilities" and "household assets".
[Summary]
Major durable goods owned by multi-person households
As for major durable goods ownership per 1,000 multi-person households*2), the largest quantity was recorded for room air-conditioners (2,478), followed by cellular phones (2,131), chests of drawers (1,790), and wardrobes (1,494).Regarding ownership rates (the rate of households that owned major durable goods), the household durables that showed higher rates were items such as washing machines (99.5%), vacuum cleaners (98.8%), refrigerators (98.7%), microwave ovens (97.5%), and cellular phones (92.7%).
*2) "Multi-person households" refers to a group of persons sharing living quarters and living expenses.
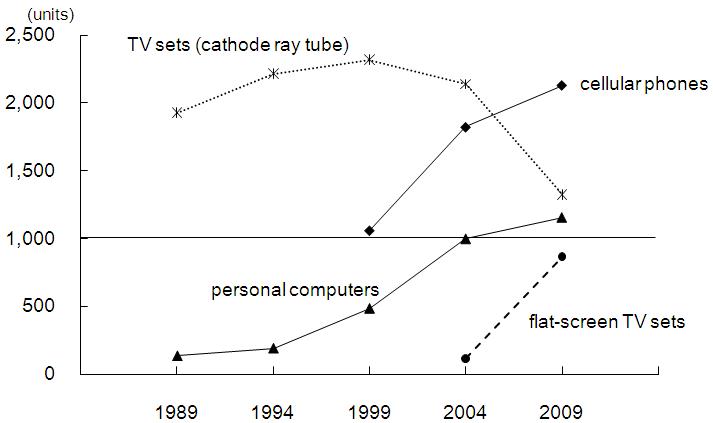
Cellular phones, personal computers and flat-screen TVs increased
Compared with 2004, flat-screen TV ownership per 1,000 multi-person households dramatically increased by 652.2% from 115 to 865 units, cellular phone ownership increased by 16.9% from 1,823 to 2,131 units, and personal computer increased by 15.8% from 999 to 1,157 units. Figure 1 Changes of ownership quantities per 1,000 households of cellular phones, personal computers and TV sets (multi-person households)
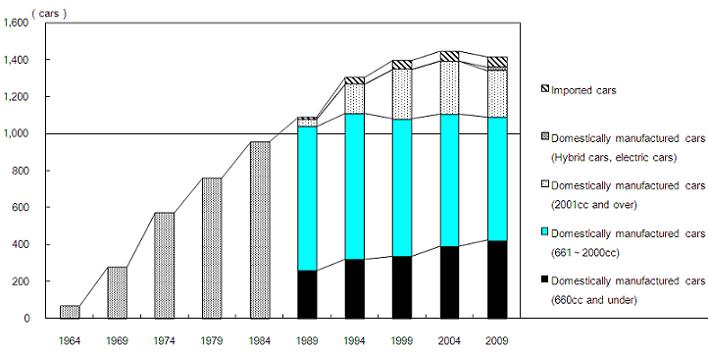
Car ownership quantities decreased for the first time since the first survey in 1959
Car ownership numbered 1,414 per 1,000 multi-person households. Broken down by type, domestically manufactured cars numbered 1,360 versus 53 imported cars. In terms of the engine displacement, the figure of small cars (661-2000cc displacement) was the highest with 668, while that of hybrid cars and electric cars which were added to the survey items in 2009 was 19.Compared with 2004, car ownership quantities decreased by 2.2%, the first decrease since the survey started in 1959.
Figure2 Changes of ownership quantities per 1,000 households of cars (multi-person households)
Major durable goods owned by one-person households
As for ownership of major durables for one-person households of younger age, three most owned durable goods for males under 30 years were: cellular phones (1,027 units per 1,000 households), refrigerators (920) and microwave ovens (876). For females under 30 years, three most owned durable goods were: cellular phones (1,012), refrigerators (968), and microwave ovens (967).The elderly one-person households owned different kinds of durable goods. Males of 65 years and older owned: air-conditioners (1,526 units per 1,000 households), followed by cupboards/ cabinets (1,234) and vacuum cleaners (1,162). For females of the same age group, the most owned durable goods was also air-conditioners (1,738), followed by cupboards/ cabinets (1,445) and chests of drawers (1,344).
(Source) 2009 National Survey of Family Income and Expenditure (SBJ)
For further details, see the web site below.
http://www.stat.go.jp/english/data/zensho/index.htm
![]()
![]()