Main contents start here
News Bulletin
RECENT RELEASE
2009 Results of Family Savings and Liabilities Released - From the Family Income and Expenditure Survey -
The 2009 results regarding family savings and liabilities as found by the Family Income and Expenditure Survey (multi-person-households*1)) were released on May 14, 2010 by the SBJ. This survey covering all households in Japan (sample survey, overall sample size around 9,000 households) has been conducted to reveal the actual condition of family income and expenditure. In this survey, the SBJ releases the results of "Income and Expenditure" and "Savings and Liabilities" of households.
The results of "Savings and Liabilities", which the SBJ has just released, provide statistics on the amount of savings and liabilities of multi-person households by household characteristics.
*1) "Multi-person households" refers to a group of persons sharing living quarters and living expenses.
Savings
In 2009 the average amount of savings per household was ?16.38 million, a decrease of 2.5% compared with the previous year (?16.80 million). The savings to yearly-income ratio was 260.0%, down by 3.7 points, as the yearly income was ?6.30 million, a decrease of 1.1% compared with the previous year (?6.37 million).As for workers' households*2) among multi-person households, the amount of savings per household was ?12.03 million, a decrease of 3.8% compared with the previous year (?12.50 million). The savings to yearly-income ratio was 169.7%, down by 4.6 points, as the yearly income was ?7.09 million, a decrease of 1.1% compared with the previous year (?7.17 million).
*2) "Workers' households" refers to households whose heads are wage earners employed by public or private sectors. The households whose heads are executive officers such as presidents, directors and commissioners, however, are classified as "Other Households".
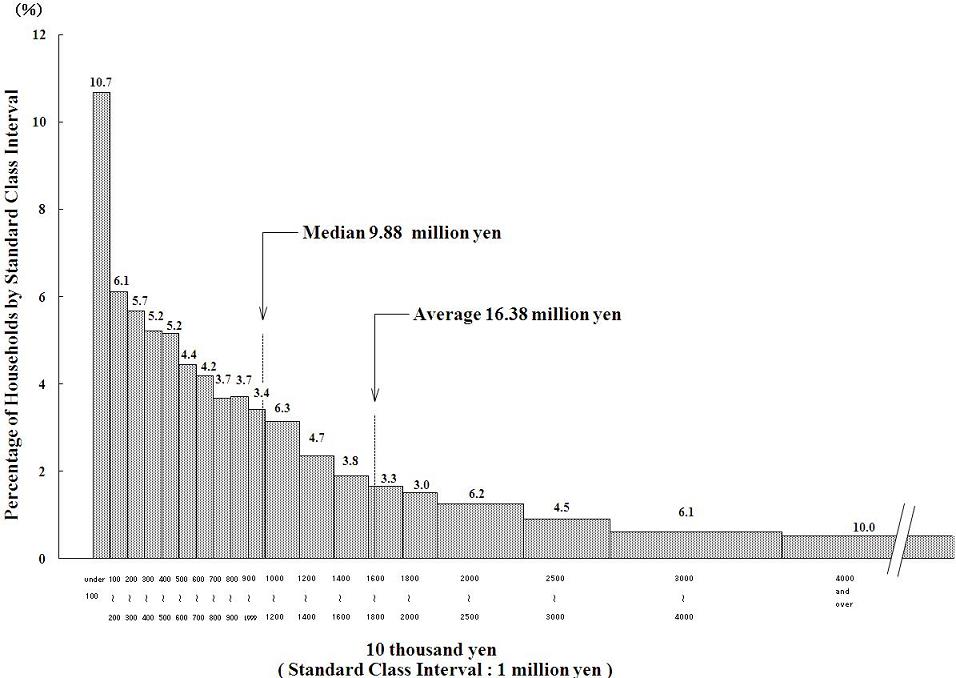
Concerning the distribution of households by amount of savings, 67.6% of the households had savings below the average (?16.38 million), which was the same as in the previous year). In other words, the distribution was skewed to the lower side. The household group with less than ?1 million savings made up 10.7% of all households, remaining at the same percentage as in the previous year.
The median amount of savings (excluding households whose amount of savings were zero) decreased to ?9.88 million (?9.95 million in the previous year).
As for workers' households, the amount of savings per household was ?12.03 million and its median was ?7.54 million, both of which were lower than those of multi-person households. The workers' households group with less than ?1 million savings was the mode of distribution with a share of 12.7%, up by 0.2 points compared with the previous year (12.5%). (Figure 1)
Figure1 Distribution of Households by Amount of Savings -2009- (Multi-person households)
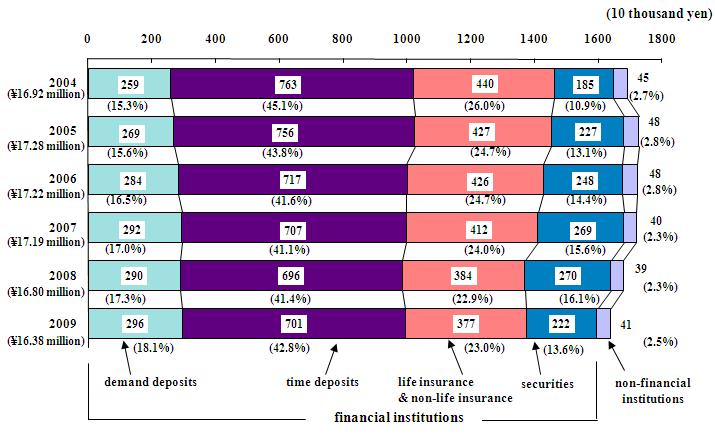
With regard to the type for multi-person households, "time deposits" were the largest at ?7.01 million (42.8% of the total amount), followed by "life insurance & non-life insurance" at ?3.77 million (23.0%), "demand deposits" at ?2.96 million (18.1%), "securities" at ?2.22 million (13.6%) and "deposits in non-financial institutions*3)" at ?0.41 million (2.5%) (Figure 2).
As for workers' households, the findings are almost identical to multi-person households: "time deposits" at ?4.60 million (38.2%), "life insurance & non-life insurance" at ?3.22 million (26.8%), "demand deposits" at ?2.40 million (20.0%), "securities" at ?1.24 million (10.3%), and "deposits in non-financial institutions" at ?0.58 million (4.8%).
The amount of "time deposits" and "life insurance & non-life insurance" for both multi-person households and workers' households continued to decrease between 2004 and 2008 against the background of the low interest rates and the drop of yield on investments. In 2009, however, "time deposits" of multi-person households went up. On the other hand, "demand deposits" and "securities" continued to increase between 2004 and 2008. In 2009, however, "securities" for both multi-person households and workers' households largely went down.
*3) "Deposits in non-financial institutions" are deposits which are deposited to non-financial institutions, such as accounts for company employees and the like.
Figure2 The Amount of Savings by Type of Savings and Percentage (Multi-person households)
Liabilities
The average amount of liabilities per household was ?4.79 million, a decrease of 3.8% compared with the previous year (?4.98 million). As for workers' households, the corresponding figure was ?6.43 million, a decrease of 1.4% compared with the previous year (?6.52 million).The liabilities to yearly-income ratio was 76.0%, down by 2.2 points compared with the previous year. Concerning workers' households, the ratio was 90.7%, down by 0.2 points.
With regard to the amount of liabilities by type, the purchase of houses and/or lands, which occupied about 90% of total liabilities, was ?4.29 million, a decrease of 3.4% compared with the previous year (?4.44 million). As for workers' households, the corresponding figure was ?5.96 million, a decrease of 1.2% compared with the previous year.
As for details, the amount of liabilities to public financial institutes declined both for multi-person households and workers' households compared with the previous year, while those to private finance companies rose for both multi-person households and workers' households.
(Source) Family Income and Expenditure Survey (SBJ)
For further details, see the web site below.
http://www.stat.go.jp/english/data/kakei/index.htm
![]()
![]()