Main contents start here
News Bulletin
RECENT RELEASE
Japan's Population Estimates Released
[Introduction]
In April 2010, the Statistics Bureau of Japan (SBJ) released the Current Population Estimates (annual report*1)) as of October 1, 2009.
*1) The SBJ publishes two kinds of reports on Current Population Estimates: Annual report on estimates as of October 1 and Monthly report on estimates as of the first day of each month. The annual report includes more detailed information ("population by age (single year) and sex for Japan" and "population by age (5-year age group) and sex for prefectures") compared with the monthly report which consists of "population by age (5-year age group) and sex for Japan" only.
Statistics on Japan's population is obtained in detail from the Population Census conducted by the SBJ every five years. Furthermore, during the inter-census period, the SBJ has been compiling the Current Population Estimates, based on the latest census population data, and extrapolated from there using Natural Change (Live births, Deaths) and Migration Change (Immigration, Emigration) derived from the Vital Statistics (Ministry of Health, Labour and Welfare) and the Statistics on Legal Migrants (Ministry of Justice), etc.
The summary of the estimates as of October 1, 2009 is as follows.
[Summary]
Total population decreased by 183 thousand, its rate of decline exceeded the previous year
? The total population numbered 127,510 thousand, decreasing by 183 thousand (0.14%). It went down for the second straight year, and its rate of decline exceeded the previous year.? Broken down by sex, the male population decreased by 121 thousand (0.20%), declining for the fifth consecutive year. On the other hand, the female population decreased by 61 thousand (0.09%), declining for the second consecutive year.
The natural change of the female population turned negative for the first time
? The natural change stayed negative for the third straight year, and its rate of decline increased.? Broken down by sex, the natural decrease of the male population continued for the fifth consecutive year, and that of the female population turned negative for the first time since 1950*2).
*2) A time-series comparison is applicable to the data from 1950.
The migration change of foreign population turned negative for the first time in fifteen years since 1994, its rate of decline marked a record high
? The migration change was negative for the second consecutive year, and the annual decrease exceeded 100 thousand for the first time since 1950*2).? Both the migration change of Japanese population and that of foreign population went down. The migration change of foreign population turned negative for the first time in fifteen years since 1994, and its rate of decline marked a record high.
Table1 Trends in the Population by sex (2002-2009)
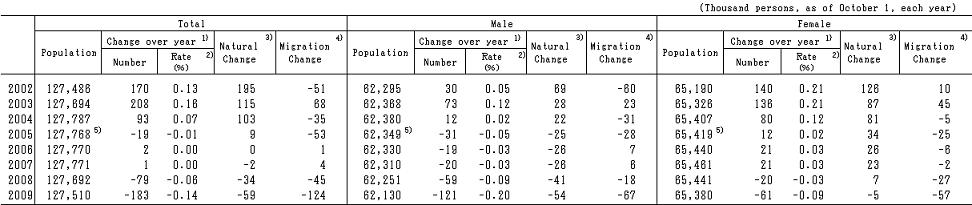
1) Population change in absolute numbers over the year (form previous October to current September)
2)
3) Natural Change = Live births - Deaths
4) Migration Change = Immigration - Emigration
5) The population in 2005 is based on the 2005 census population data
Figure1 Change in number of population by natural and migration change (1985-2009)
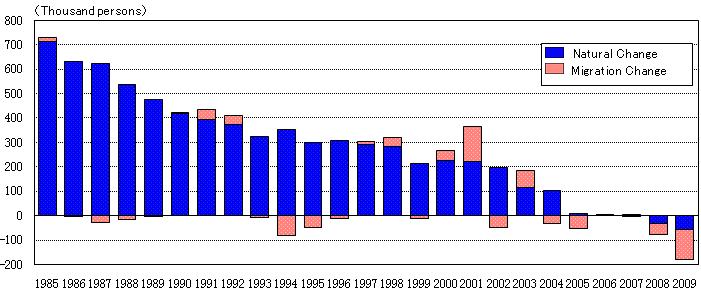
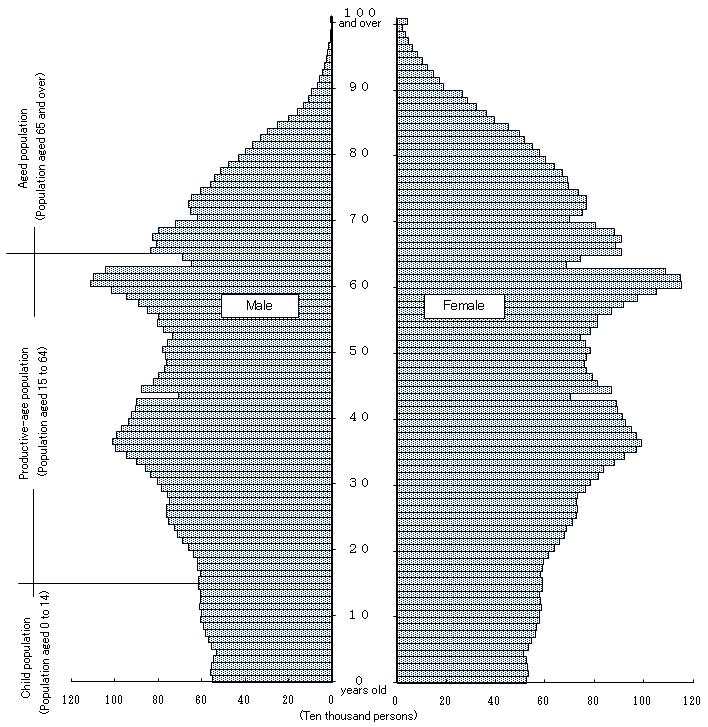
Figure2 Population Pyramid (as of October 1, 2009)
(Source) The Current Population Estimates (SBJ)
For further details, see the web site below.
http://www.stat.go.jp/english/data/jinsui/index.htm
![]()
![]()