Main contents start here
News Bulletin
RECENT RELEASE
2009 results of Family Income and Expenditure Survey (Total Households) Released
[Introduction]
The SBJ released the 2009 results (Income and Expenditure, total households1)) on February 16, 2010. This survey covering households in Japan (sample survey, sample size around 9,000 households) has been conducted in order to reveal the actual conditions of family income and expenditure.
In addition, the results of "Savings and Liabilities" will be released in May, 2010.
1) "Total households" are households which consist of "two-or-more-persons households" and "one-person households".
[Summary]
Monthly consumption expenditure per household was 253,720 yen, a decrease of 2.9% in nominal terms and 1.4% in real terms, compared with the previous year. It decreased for two consecutive years in both terms.
Monthly consumption expenditure of workers' households2) was 283,685 yen, a decrease of 2.7% in nominal terms and 1.2% in real terms.
2)"Workers' households" refers to households whose heads are employed as employees of public or private enterprises, such as government offices, private companies, factories, schools, hospitals, shops ,etc. Households whose heads are executive officers such as presidents, directors and commissioners are classified as "Other Households"
Monthly income per workers' household was 464,649 yen, a decrease of 4.6% in nominal terms and 3.1% in real terms. By income categories, regular income of household heads decreased by 1.8%, temporary incomes and bonuses decreased by 11.7% in real terms.
Among expenditure for goods3) and services, average spending on goods remained at the same level in real terms. In further detail, spending on durable goods increased by 9.3% in real terms, but that on semi-durable goods and non-durable goods decreased by 3.8% and 0.3% in real terms respectively.
Spending on services decreased by 2.0% in real terms.
3)"Goods" are divided into following three categories.
"Durable goods"...Goods which have an expected lifespan of one year or more, and whose prices are comparatively expensive.
"Semi-durable goods"...Goods which have an expected lifespan of one year or more, but whose prices are less expensive than "Durable goods".
"Non-durable goods"...Goods which have an expected lifespan of less than one year.
Figure1: Changes in Consumption Expenditures from the Previous Year
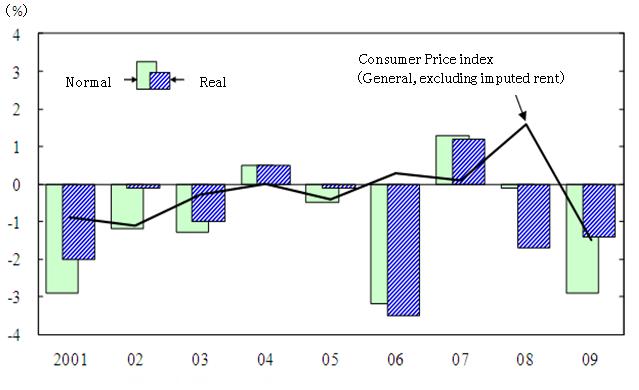
(Source) Family Income and Expenditure Survey (SBJ)
For further details, see the web site below.
http://www.stat.go.jp/english/data/kakei/index.htm
![]()
![]()