Main contents start here
News Bulletin
March 1, 2010
RECENT RELEASE
Results of October 2009 Monthly Survey on Service Industries Released
[Introduction]
The main aim of the Monthly Survey on Service Industries is to provide monthly estimates of sales amount (income) and number of employees in service industries, and to enhance the accuracy of economic indicators such as Quarterly Estimates (QE) of GDP.
Examining changes in the industrial structure in Japan, the tertiary industry's shares of both GDP and number of employees have gradually risen. However, existing statistical surveys have not well covered the entire range of service sectors. Thus the need for a survey to measure the changes in sales amount (income) and number of employees working in service industries are required. The first results of the survey were released on December 25, 2009. This will enable the government to formulate appropriate economic policy planning.
[Summary]
The monthly sales amount (income) of the service industry in October 2009 was 24.6 trillion yen, a decrease of 2.9% from the previous year. By industry (major groups)*), "Services, N.E.C (not elsewhere classified)" was 2.4 trillion yen, the highest decrease of 11.4%. On the other hand, "Scientific research, professional and technical services" and "Medical, health care and welfare" increased.
The number of employees working in the service industry was 26.74 million, an increase of 0.7% from the previous year. By industry (major groups), six industries increased such as "Education, learning support" and "Medical, health care and welfare".
Table1 Monthly Sales Amount (Income) and Number of Employees by Industry (major groups)
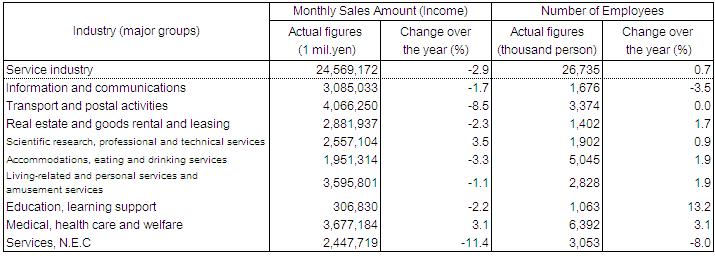
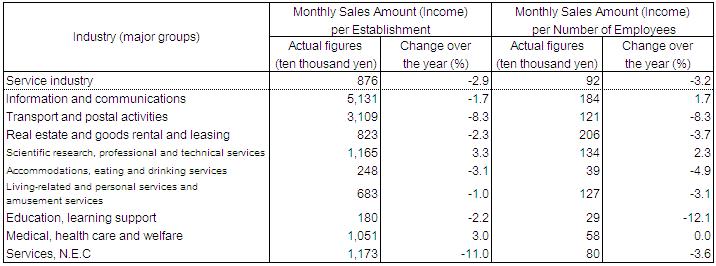
Table2 Monthly Sales Amount (Income) per Establishment and per Number of Employees by Industry (major groups)
*) The "industry (major groups)" stands for the "major groups" of the Japan Standard Industrial Classification (Rev. 12, November 2007).
Japan Standard Industrial Calssification:
http://www.soumu.go.jp/english/dgpp_ss/seido/sangyo/index.htm
(Source) Monthly Survey on Service Industries (SBJ)
For further survey information, see the web site below.
http://www.stat.go.jp/english/data/mssi/index.htm
![]()
![]()