Main contents start here
News Bulletin
NEWS HIGHLIGHTS
Aged population and households in Japan -In celebration of "Senior Citizens Day"-
The SBJ published a report analyzing the conditions of the aged*1) population and households in celebration of the "Senior Citizens Day" (September 21, 2009).
*1) "Aged" hereinafter is defined as the population aged 65 years old and over
The percentage of aged population was 22.7%, highest ever
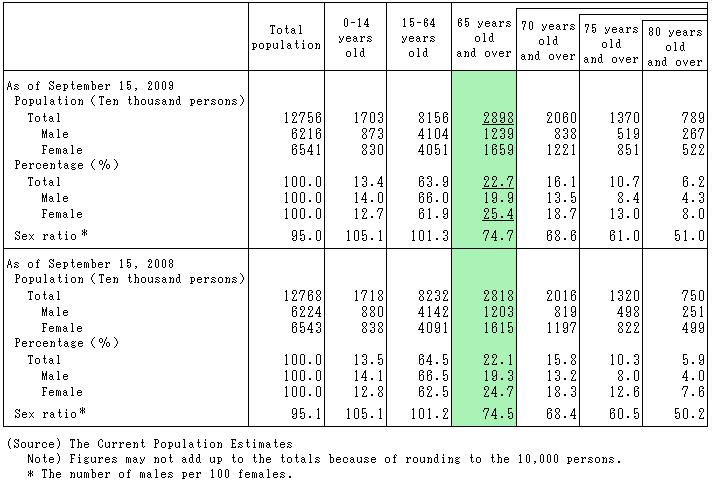
As of September 15, 2009, the aged population in Japan was estimated as 28.98 million, constituting 22.7% of the total population. This was an increase of 0.8 million (0.6 points) compared with the previous year. Both the number and the percentage of aged population marked record highs.The number of the aged population increased for all the three aged group. The population 70 years old and over was 20.6 million (16.1% of the total population), an increase of 0.44 million compared with the previous year, the population 75 years old and over was 13.7 million (10.7%), an increase of 0.5 million, and the population 80 years old and over was 7.89 million (6.2%), an increase of 0.39 million. (Table 1)
Table1 Population and percentage by age (3 groups) (2008, 2009)
1 in 4 of the female population was aged 65 years or older
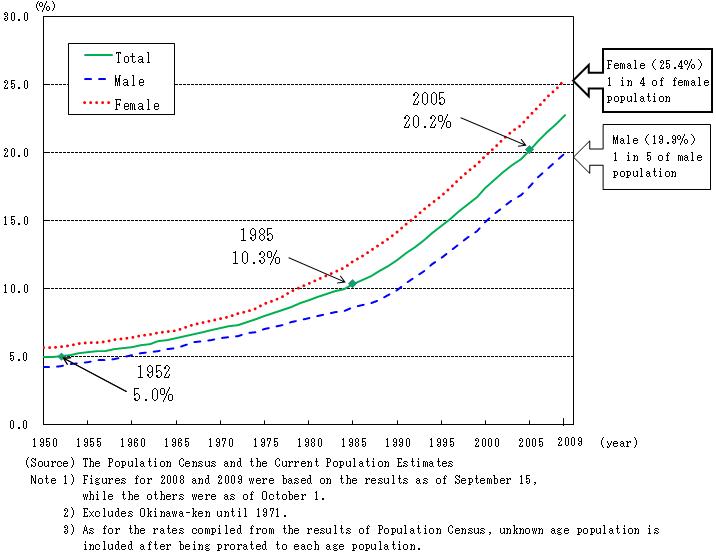
The percentage of the aged population sharply climbed up from 4.9% in 1950 to 22.7% in 2009. During this period, the percentage reached to 5.0% in 1952, and exceeded 10% in 1985. In 2005, it exceeded 20%, and finally reached to 22.7% in 2009.Broken down by sex, the percentage of aged males was 19.9% of the total male population (1 in 5 of the male population was aged), while that of aged females was 25.4% of the total female population, exceeding 25% for the first time (1 in 4 of the female population was aged). (Figure1)
Figure1 Change in the percentage of the aged population by sex (1950-2009)
Aged households continued to increase
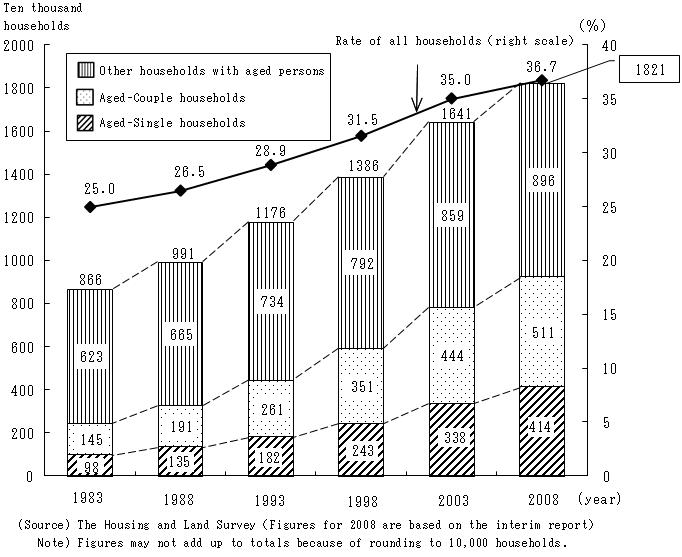
The number of aged households*2) increased from 8.66 million in 1983 to 18.21 million in 2008. During this period, the number reached to 11.76 million in 1993, exceeding 10 million for the first time. In 2003, it exceeded 15 million, continued to increase, and finally reached to 18.21 million in 2008.The percentage of aged households of all households*3) also continued to increase: 25% (one fourth) in 1983, 35% in 2003 and 36.7% in 2008, exceeding one third.
Broken down in the change of aged households for 25 years (1983-2008), "Aged-Single households" increased by 4.2 times, "Aged-Couple households" by 3.5 times and "Other households with aged persons" by 1.4 times. "Aged-Single households" had the highest increase (percentage) (Figure 2).
Figure2 Change in households with aged persons (1983-2008)
*2) "Aged households" are defined as households with related members aged 65 years old and over. This is grouped into 3 categories as follows.
1. Aged-Single households...Households comprising only one person aged 65 years old and over
2. Aged-Couple households...Households comprising only one couple either or both of whom are aged 65 years old and over
3. Other households with aged persons...Households with at least one aged persons excluding the above 2 types of households (households consisting of aged persons and other household members)
The results of "Aged households" have been tabulated since 1983.
*3) All households...Households excluding those living in facilities, such as hospitals, nursing homes and so on.
(Source)
For further information on surveys and estimates, see the web site below.
The Population Census (SBJ)
http://www.stat.go.jp/english/data/kokusei/index.htm
The Current Population Estimate (SBJ)
http://www.stat.go.jp/english/data/jinsui/index.htm
The Housing and Land Survey (SBJ)
http://www.stat.go.jp/english/data/jyutaku/index.htm
![]()
![]()