Main contents start here
News Bulletin
NEWS HIGHLIGHTS
2008 Yearly Averages of Family Savings and Liabilities Released - From the Results of Family Income and Expenditure Survey -
The 2008 yearly averages of family savings and liabilities of the Family Income and Expenditure Survey (two-or-more-person households) were released in June 2009 by the SBJ. This survey covering all households in Japan (sample survey, overall sample size around 9,000 households) has been conducted to reveal the actual conditions of family income and expenditure. In this survey, the SBJ has released the results of "Income and Expenditure" and "Savings and Liabilities".
The data refers to the households with two-or-more-persons, more detailed statistics by household characteristics are also provided.
Savings
The 2008 average amount of savings per household was ?16.80 million, a decrease of 2.3% compared with the previous year (?17.19 million). The savings to yearly-income ratio was 263.7%, down by 1.2 points, as the yearly income was ?6.37 million, a decrease of 1.8% compared with the previous year (?6.49 million).As for workers' households1), the amount of savings per household was ?12.50 million, a decrease of 1.4% compared with the previous year (?12.68 million). The savings to yearly-income ratio was 174.3%, down by 2.3 points, as the yearly income was ?7.17 million, a decrease of 0.1% compared with the previous year (?7.18 million).
1) "Workers' households" refers to households whose heads are employed as clerks or wage earners by public or private enterprises, such as government offices, private companies, factories, schools, hospitals, shops ,etc. However, the households whose heads are executive officers such as presidents, directors and commissioners are classified as "Other Households"
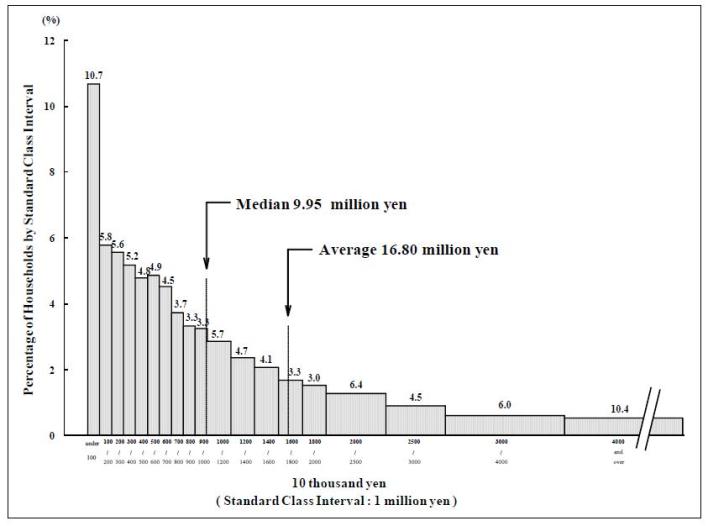
Concerning the distribution of the savings, households below the average (?16.80 million) accounted for 67.6% (67.8% in the previous year). In other words, the distribution was skewed to the lower side. The household group with less than ?1 million savings was 10.7% of all households, up by 1.4 points compared with the previous year (9.3%).
The median2) amount of savings, which is the middle point in the sequence of households arranged in order of the amount (excluding households whose amount of savings is zero) decreased to ?9.95 million (?10.18 million in the previous year).
As for workers' households, the amount of savings per household was ?12.50 million and its median was ?7.57 million, which showed both of them were lower than those of two-or-more-person households. The workers' households group with less than ?1 million savings was the mode of distribution with a share of 12.5%, up by 1.2 points compared with the previous year (11.3%). (Figure 1)
2) "The median" is the middle number when the data set is arranged in numerical order.
Figure1 Distribution of Households by Amount of Savings (Two-or-more-person households)
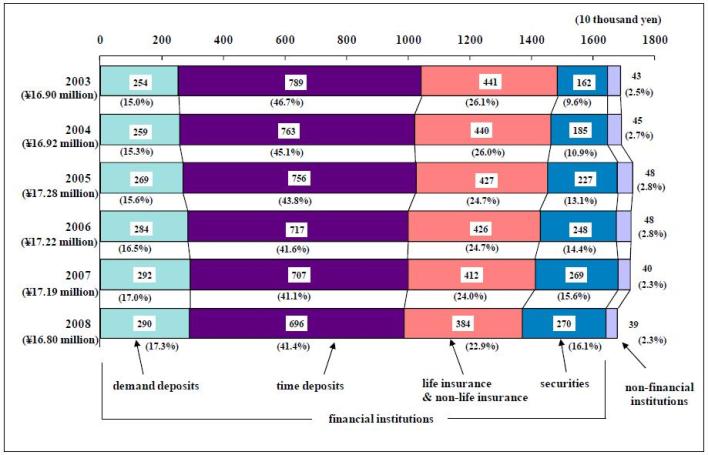
With regard to the amount of savings by type of savings for two-or-more-person households, "time deposits" were the largest in amount at ?6.96 million (the percentage of the total amount of savings was 41.4%), followed by "life insurance & non-life insurance" at ?3.84 million (22.9%), "demand deposits" at ?2.90 million (17.3%), "securities" at ?2.70 million (16.1%) and "deposits in non-financial institutions3)" at ?0.39 million (2.3%). (Figure 2)
As for workers' households, the share is in the same order as two-or-more-person households: "time deposits" at ?4.79 million (38.3%), "life insurance & non-life insurance" at ?3.34 million (26.7%), "demand deposits" at ?2.34 million (18.7%), "securities" at ?1.47 million (11.8%), and "deposits in non-financial institutions" at ?0.55 million (4.4%).
The amount of "time deposits" and "life insurance & non-life insurance" for both two-or-more-person households and workers' households had continued to decrease since 2003 against the background of the recent low interest and the decrease of yield on investments (except for 2005 for workers' households). In 2008, "time deposits" of workers' households increased. On the other hand, "demand deposits" and "securities" had continued to increase since 2003. In 2008, "demand deposits" for two-or-more-person households and "securities" for workers' households decreased.
3) "Deposits in non-financial institutions" are deposits which are consigned to other than financial institutions such as one's own companies and the like.
Figure2 The Amount of Savings by Type of Savings and Percentage (Two-or-more-person households)
Liabilities
The average amount of liabilities per household was ?4.98 million, a decrease of 1.4% compared with the previous year (?5.05 million). As for workers' households, the same was ?6.52 million, a decrease of 1.8% compared with the previous year (?6.64 million). The liabilities to yearly-income ratio was 78.2%, up by 0.4 points compared with the previous year, while that of workers' households was 90.9%, down by 1.6 points.With regard to the amount of liabilities by type, the purchase of houses and/or land, which occupied about 90% of total liabilities, was ?4.44 million, a decrease of 0.9% compared with the previous year (?4.48 million). As for workers' households, the same was ?6.03 million, a decrease of 1.8% compared with the previous year. As for details, the amount of liabilities to public financial institutes decreased both for two-or-more-person households and workers' households compared with the previous year, while those to private finance companies increased for two-or-more-person households but decreased for workers' households.
(Source) Family Income and Expenditure Survey (SBJ)
The yearly average figures in 2008 were released on June 16, 2009, and the Annual Reports was published on September 15, 2009.
For further details, see the web site below.
http://www.stat.go.jp/english/data/kakei/index.htm
![]()
![]()