Main contents start here
News Bulletin
RECENT RELEASE
Japan? Population Estimates released
In April 2009, the Statistics Bureau of Japan (SBJ) released the Current Population Estimates (annual report)1*) as of October 1, 2008.
Note: 1*) The SBJ publishes two kinds of reports on Current Population Estimates: Annual report on estimates as of October 1 and Monthly report on estimates as of the first day of each month. The annual report includes more detail information ("population by age (single year) and sex for Japan" and "population by age (5-year age group) and sex for prefectures") compared with the monthly report which consists of "population by age (single year) and sex for Japan" only.
Statistics on Japan? population is obtained in detail from the Population Census conducted by the SBJ every five years. Furthermore, during the inter-census period, the SBJ has been compiling the Current Population Estimates, based on the latest census population data, and extrapolated from there using Natural Change (Live births, Deaths) and Migration Change (immigration, emigration) derived from the Vital Statistics (Ministry of Health, Labour and Welfare) and the Statistical Survey on Legal Migrants (Ministry of Justice), etc.
The summary of the estimates as of October 1, 2008 is as follows.
1. Total Population
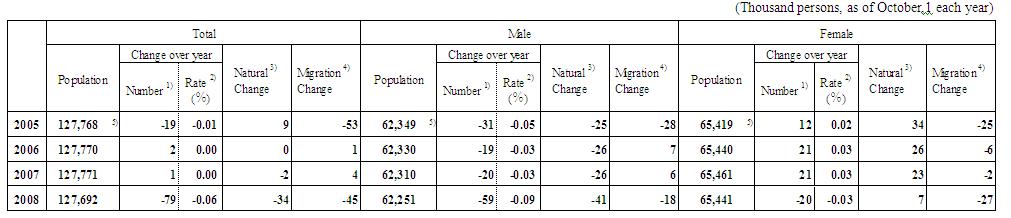
- The total population numbered 127,692 thousand, and decreased by 79 thousand from the previous year. The rate of decrease was 0.06 percent. The total population decreased for the first time in three years. (Table1)- The male population numbered 62,251 thousand, a decrease of 59 thousand (0.09 percent), while the female population numbered 65,441 thousand, a decrease of 20 thousand (0.03 percent) from the previous year.
The male population decreased for four consecutive years, while the female population decreased for the first time since 1950 2*). (Table1)
- The natural decrease accelerated in comparison with the previous year, while the social decrease marked for the first time in three years.
Table 1 Trends in the Population by sex (2005-2008)
2. Population by Age Group
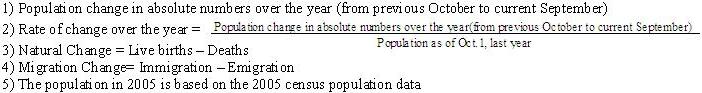
- The population aged 0 to 14 (child population) numbered 17,176 thousand and accounted for 13.5 percent of the total population, the same rate as the previous year.- The population aged 15 to 64 (productive-age population) numbered 82,300 thousand and accounted for 64.5 percent of the total population, a decrease of 0.5 points from the previous year.
- The population aged 65 and over (aged population) numbered 28,216 thousand and accounted for 22.1 percent of the total population, an increase of 0.6 points which was the record-high rate since 1950 2*). (Table2, Figure1)
Table2 Composition of Population by age group (2007, 2008)
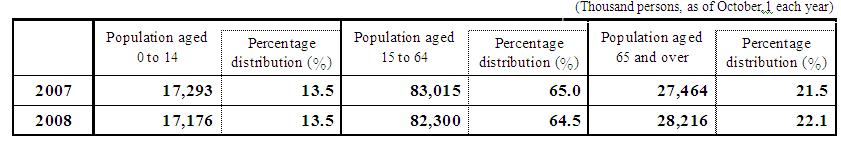
Figure1 Population pyramid (as of October 1, 2008)
(Source) The Current Population Estimates (SBJ)
The Annual Report was published in June.
For further this estimates details, see the web site below.
http://www.stat.go.jp/english/data/jinsui/index.htm
![]()
![]()