Main contents start here
News Bulletin
RECENT RELEASE
Results of the 2007 National Survey of Prices
- Outlet Prices -
As part of the reports of the 2007 National Survey of Prices, "Results for Outlet Prices" was released on March 27, 2009. This report includes prices of goods at retail outlets and services at establishments engaged in service industries.
Differentials by outlet
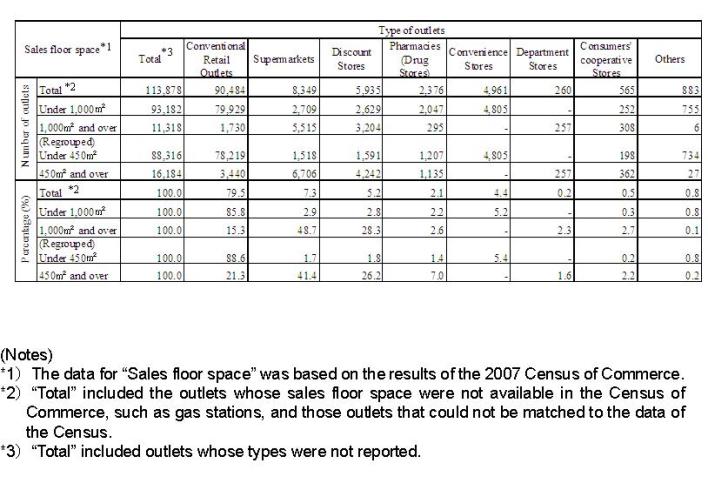
The total number of tabulated outlets of the 2007 National Survey of Prices was 113,878. With regard to type of outlets, the percentage of Conventional Retail Outlets was 79.5%, followed by Supermarkets (7.3%), Discount Stores (5.2%) and Convenience Stores (4.4%). (Table 1)
Table 1 Number and percentage of outlets by type of outlets and sales floor space
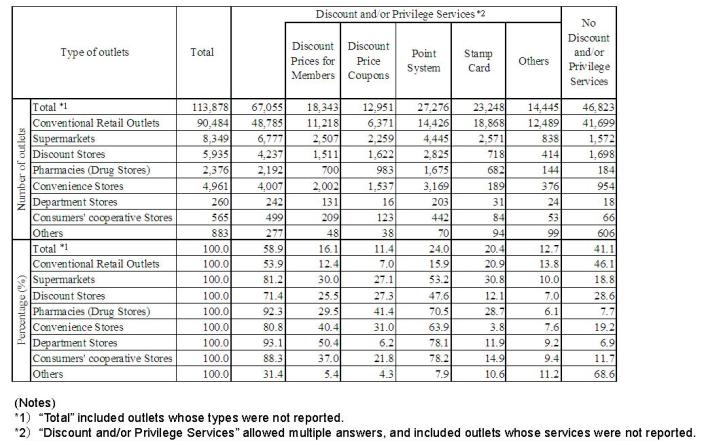
Number and percentage of outlets by Discount and/or Privilege Service
To clarify the current status of outlets and prices, this survey included a new item which studies whether the outlets offer the "Discount and/or Privilege Services" or not.
The percentage of outlets that offer the "Discount and/or Privilege Services" was 58.9%. Regarding the type of outlets, the percentage of Department Stores was the highest (93.1%), followed by Pharmacies (92.3%), Consumers' cooperative Stores (88.3%), Supermarkets (81.2%) and Convenience Stores (80.8%).
With regard to the type of services, the percentage of outlets that offer a "Point System" was the highest (24.0%). The "Point System" was the most popular among the types of service for almost all the types of outlets. The percentage of outlets offering the "Point System" was as follows: Consumers' cooperative Stores (78.2%), Department Stores (78.1%), Pharmacies (70.5%), Convenience Stores (63.9%), Supermarkets (53.2%) and Discount Stores (47.6%). (Table 2)
Table2 Number and percentage of outlets by Discount and/or Privilege Service and type of outlets
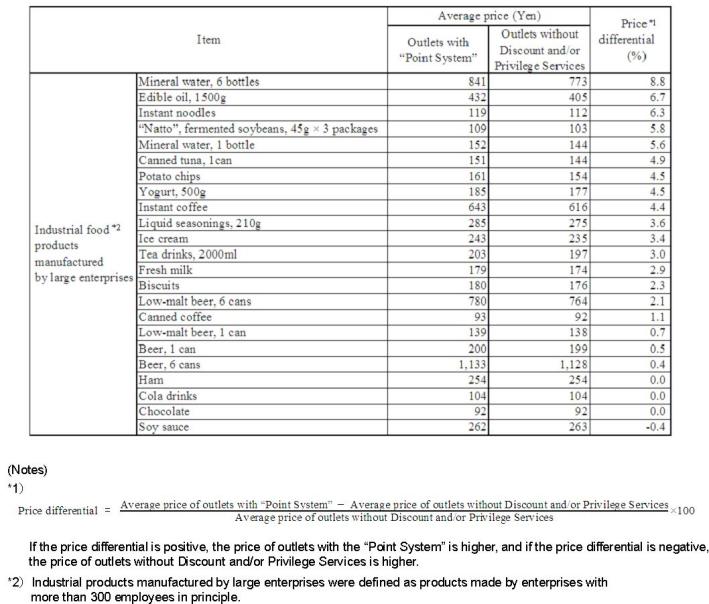
Price differential between outlets with "Point System" relative to those without any services
With regard to the majority of industrial food products manufactured by large enterprises the average prices at Supermarkets that offer the "Point System" were generally higher than those that do not offer any Discount and/or Privilege Services. (Table 3)
Table3 Average price and price differential of outlets with the "Point System" relative to those without any services (Supermarkets)
(Source) The National Survey of Prices (Statistics Bureau, Japan)
For further this survey details, see the web site below.
http://www.stat.go.jp/english/data/zenbutu/index.htm
![]()
![]()