Main contents start here
News Bulletin
RECENT RELEASE
Results of the 2007 National Survey of Prices - Regional Price Difference Index of Prices -
As part of the result of the 2007 National Survey of Prices, regional price difference index was released on 26 December 2008. The National Survey of Prices is a large-scale quinquennial survey conducted since 1967. It aims to provide information on price differentials among types of outlet, regions, brands and other factors that affect the prices that consumers purchase in their daily life.
The 2007 survey was conducted in all cities with a population of 100,000 or more (263 cities) and 410 selected municipalities of less than 100,000. The coverage of the survey included about 130,000 retail outlets, about 40,000 establishments engaged in service industries and about 2,200 establishments engaged in online/mail-order business. The survey collected the prices of 180 items of goods and services. The survey was carried out as of 21 November 2007.
Price level by prefecture
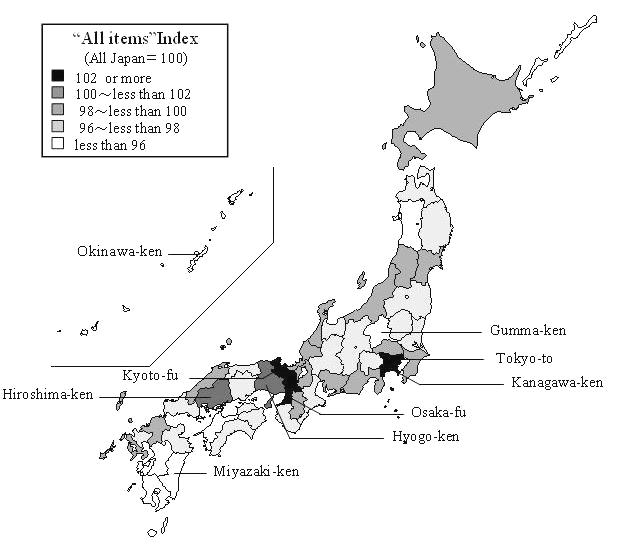
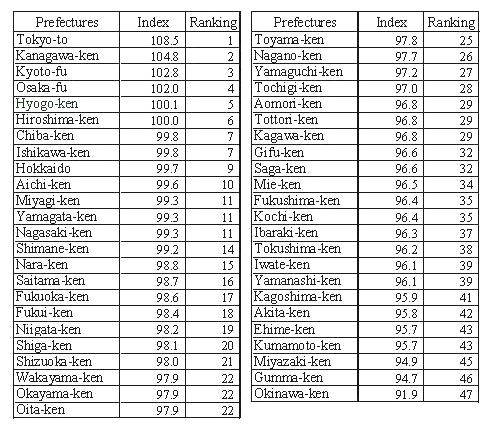
Comparing the price level of "All items" index (All Japan=100) by prefecture, Tokyo-to had the highest score in 2007, with a score of 108.5. Prefectures following the score of Tokyo-to were Kanagawa-ken (104.8), Kyoto-fu (102.8), Osaka-fu (102.0) and Hyogo-ken (100.1), which were all higher than the average of all Japan (100). The sixth highest was Hiroshima-ken, which was equivalent to the average of all Japan.
Meanwhile, Okinawa-ken had the lowest score at 91.9, followed by Gumma-ken (94.7) and Miyazaki-ken (94.9). The price level of the highest (Tokyo-to) was 18.1 percent* higher than that of Okinawa-ken. (Figure 1)
Notes:
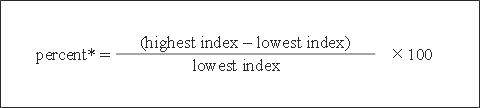
Figure 1 "All items" Index by Prefecture (All Japan=100)
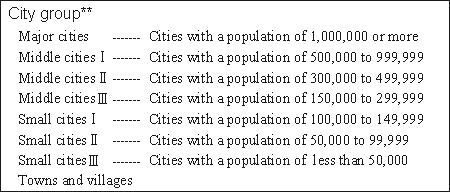
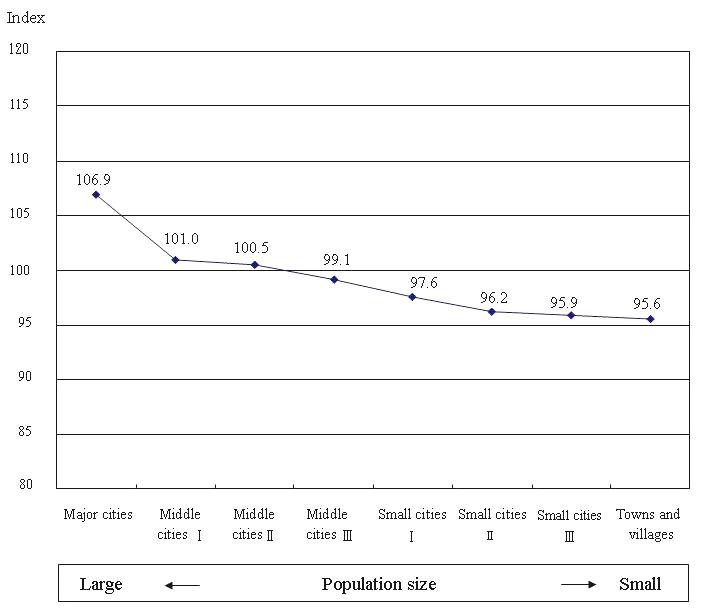
Price level by city group
With regard to the price level of "All items" index (All Japan=100) by city group*, the price level was lower for smaller municipalities. (Figure 2)
The price level of "Major cities" (population of 1 million or more) was the highest, while that of "Towns and villages" was the lowest. The former was 11.8 percent* higher than the latter.
Figure 2 "All items" Index by City Group (All Japan=100)
Notes: