Main contents start here
3. Outstanding Savings and Liabilities
(i) Outstanding Savings
a. Outstanding Savings by Prefecture
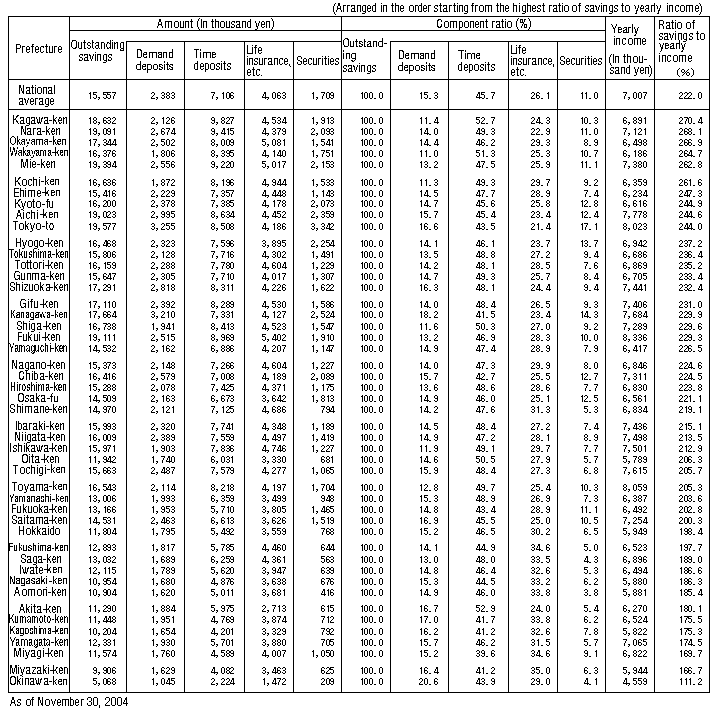
A look at outstanding savings per household by prefecture in all households shows that the households in Tokyo had the largest amount in savings at 19.58 million yen, which was followed by those in Mie, Fukui, Nara, Aichi and Kagawa. On the other hand, the households in Okinawa had the smallest amount in savings as 5.07 million yen per household, followed by the households in Miyazaki, Kagoshima, Aomori, Nagasaki and Akita.
As for the ratios of the outstanding savings by type of savings, the households in Okinawa had the largest ratio of demand deposits at 20.6% which was followed by the households in Kanagawa, Kumamoto, Saitama, Akita and Tokyo. On the other hand, the households in Wakayama had the smallest ratio of demand deposits at 11.0%, followed by the households in Kochi, Kagawa, Shiga, Ishikawa and Toyama. In terms of current balance, the households in Tokyo had the largest amount of demand deposits.
The households in Akita had the largest ratio of time deposits at 52.9% which was followed by the households in Kagawa, Wakayama, Oita, Shiga and Toyama. On the other hand, the households in Miyagi had the smallest ratio of time deposits at 39.6%, followed by Miyazaki, Kagoshima, Kanagawa, Kumamoto and Chiba. In terms of the level of time deposit, the households in Kagawa had the largest amount of time deposits.
The households in Miyazaki had the largest ratio of life insurance, etc. at 35.0% which was followed by the households in Miyagi, Fukushima, Aomori, Kumamoto and Saga. The households with higher ratios of life insurance, etc. were mainly found in the Tohoku and Kyushu regions. On the other hand, the households in Tokyo had the smallest ratio of life insurance, etc. at 21.4%, followed by Nara, Kanagawa, Aichi, Hyogo and Akita. In terms of the level of life insurance, the households in Fukui had the largest amount of life insurance, etc.
The households in Tokyo had the largest ratio of securities holdings at 17.1% which was followed by the households in Kanagawa, Hyogo, Kyoto, Chiba and Osaka. The households with higher ratios of securities holdings were mainly found in the Kanto and Kinki regions. On the other hand, the households in Aomori had the smallest ratio of securities holdings at 3.8% followed by Okinawa, Saga, Fukushima, Iwate and Shimane. The households with lower ratios of securities holdings were mainly found in the Tohoku and Kyushu regions. In terms of level of securities, the households in Tokyo had the largest amount of the securities holdings.
When the ratio of savings to yearly income was compared, the households in Kagawa had the highest ratio at 270.4% which was followed by the households in Nara, Okayama, Wakayama, Mie and Kochi. On the other hand, the households in Okinawa had the lowest ratio at 111.2% followed by the households in Miyazaki, Miyagi, Yamagata, Kagoshima and Kumamoto. (Figures VI-6, VI-7, VI-8 and Table VI-4)
Figure VI-6: Outstanding Savings by Prefecture (All Households)
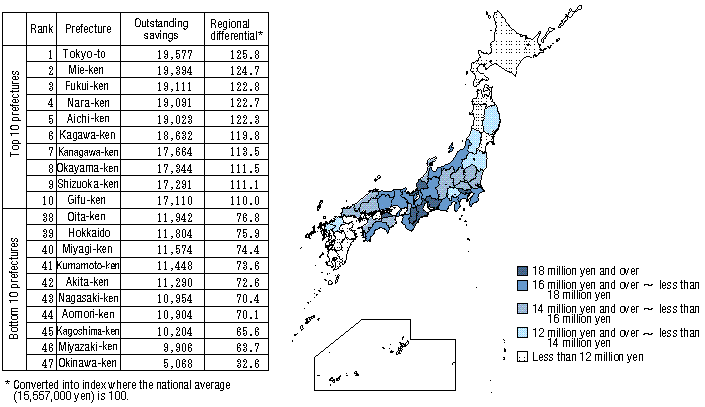
Figure VI-7: Ratio of Life Insurance to Outstanding Savings by Prefecture (All Households)
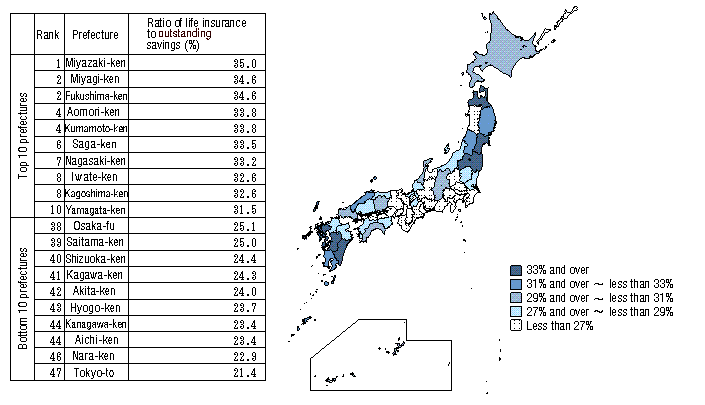
Figure VI-8: Ratio of Securities to Outstanding Savings by Prefecture (All Households)
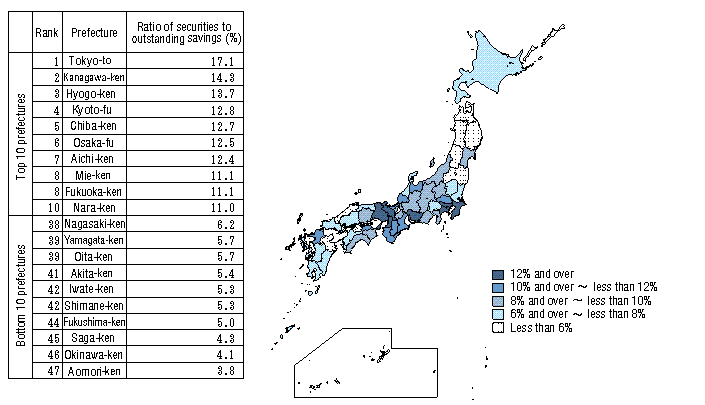
Table VI-4: Outstanding Savings by Prefecture (All Households)
b. Differentials in Outstanding Savings among Prefectures
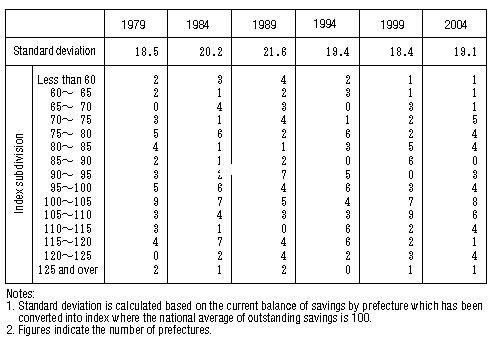
The differentials in outstanding savings per household among prefectures in all households was analyzed using the standard deviation based on the index where the national average was 100. After widening from 18.5 in 1979 to 20.2 in 1984 and narrowing thereafter to 19.4 in 1994 and 18.4 in 1999, the standard deviation expanded again to 19.1 in 2004. (Table VI-5)
Table VI-5: Changes in Standard Deviation of Outstanding Savings (All Households)
(ii) Liabilities
An analysis of the household liabilities per household by prefecture in all households reveals that the households in Tokyo had the largest amounts of liabilities at 7.77 million yen which was followed by the households in Saitama, Kanagawa, Osaka, Aichi and Shiga. The households that had larger amounts of liabilities were mainly found in the Kanto and Kinki regions. On the other hand, the households in Nagasaki had the smallest amounts of liabilities at 3.42 million yen followed by the households in Tokushima, Shimane, Kochi, Kagawa and Oita. The households with smaller amounts of liabilities were mainly found in the Shikoku and Kyushu regions.
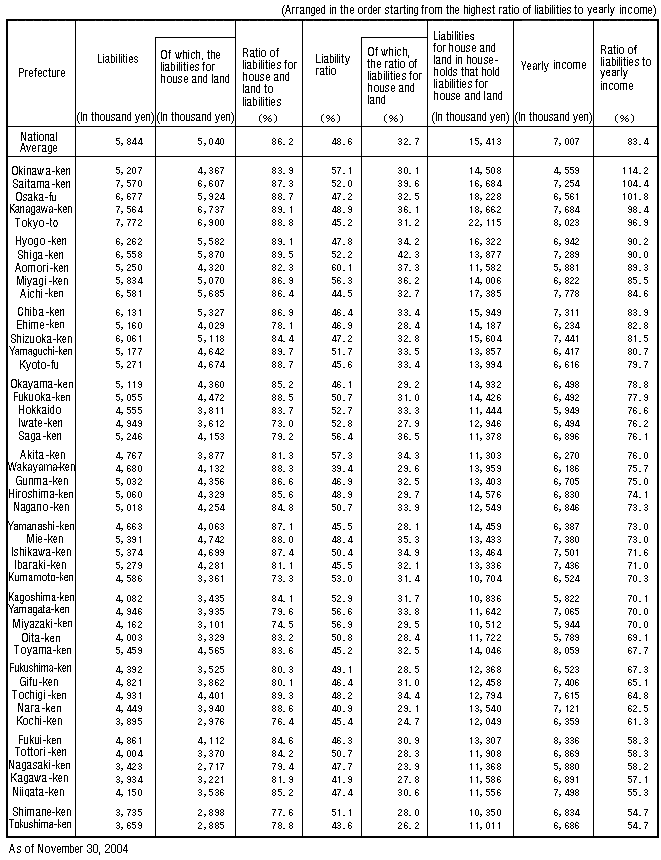
The ratio of liabilities to yearly income, was highest in households in Okinawa at 114.2% which was followed by the households in Saitama, Osaka, Kanagawa, Tokyo and Hyogo. On the other hand, the households in Shimane and Tokushima had the lowest ratio at 54.7% followed by the households in Niigata, Kagawa, Nagasaki and Tottori.
Moreover, the liabilities exceeded yearly income in the households in Okinawa, Saitama and Osaka.
The households in Shiga had the highest ratio of liabilities for purchase of houses and/or land at 42.3% which was followed by the households in Saitama, Aomori, Saga, Miyagi and Kanagawa. On the other hand, the households in Nagasaki had the lowest ratio of liabilities for purchase of houses and/or land at 23.9% followed by the households in Kochi, Tokushima, Kagawa, Iwate and Shimane.
As for the liabilities for purchase of houses and/or land in the households that had liabilities for purchase of houses and/or land, the households in Tokyo had the largest amount of liabilities at 22.12 million yen which was followed by the households in Kanagawa, Osaka, Aichi, Saitama and Hyogo. On the other hand, the households in Shimane was the smallest at 10.35 million yen followed by the households in Miyagi, Kumamoto, Kagoshima, Tokushima and Akita. (Figure VI-9, Table VI-6)
Figure VI-9: Liabilities by Prefecture (All Households)
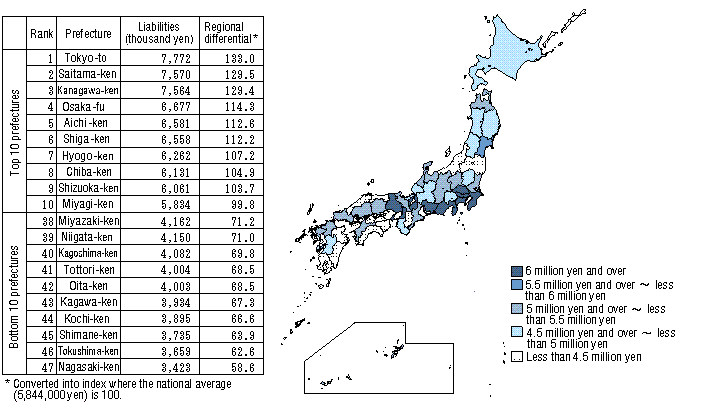
Table VI-6: Liabilities and Liability Ratio by Prefecture (All Households)
![]()
![]()