Main contents start here
Outline of Survey Results
I. Income and Expenditures in All Households
1. Living Expenditures
(i) Overview
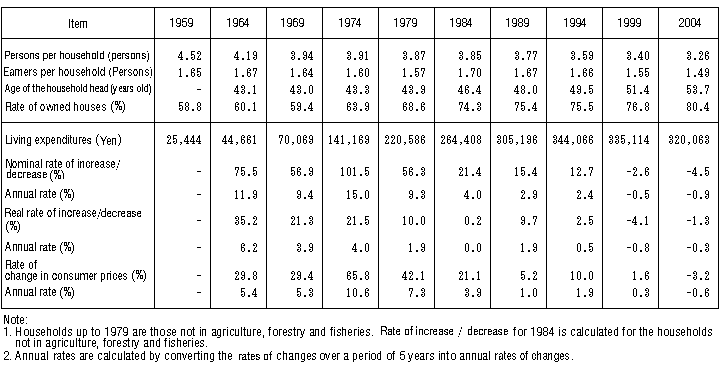
Living expenditures in all households per month during the period from September through November 2004, (hereinafter referred to as the "average monthly") was 320,063 yen per household, indicating a decline of 4.5% on a nominal basis (at an annual rate of 0.9%) and a drop of 1.3% on a real basis excluding fluctuations in consumer prices (at an annual rate of 0.3%).
The real rate of increase/decrease in living expenditures per household, since 1964, continued to become smaller and, in 1999, turning to minus for the first time since the start of the survey in 1959 and remaining negative in 2004. (Figure I-1, Table I-1)
Figure I-1: Changes in Annual Rates of Increase/Decrease in Average Monthly
Living Expenditures over Previous Survey (All Households)
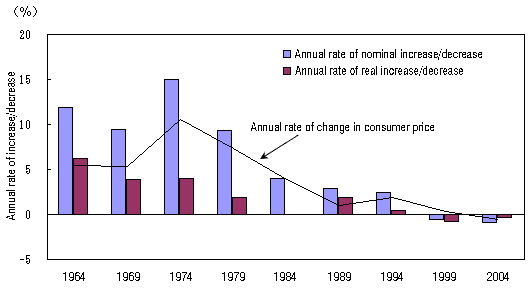
Table I-1: Changes in Average Monthly Living Expenditures (All Households)
(ii) Living Expenditures by Item
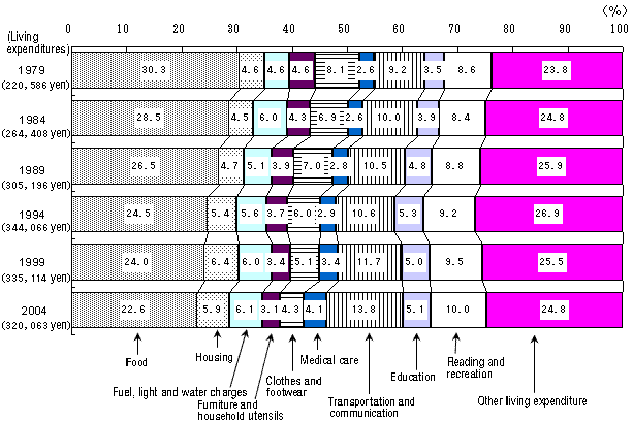
Among the item of living expenditures in all households, "other living expenditures" accounted for the largest part of the living expenditures at 24.8%, which was followed by food at 22.6%, transportation & communication at 13.8% and reading & recreation at 10.0%.
In terms of the ratio of each item to living expenditures, food consistently continued to decrease from 30.3% in 1979 to 22.6% in 2004. The ratio of clothes & footwear also declined from 8.1% in 1979 to 4.3% in 2004. Similarly, the ratio of furniture & household utensils consistently decreased from 4.6% in 1979 to 3.1% in 2004. Although "other living expenditures" continued to rise from 1979 up to 1994, it recorded a downturn in 1999 and continued to fall to 24.8% in 2004.
On the other hand, the ratio of transportation & communication continued steadily to advance from 9.2% in 1979 to 13.8% in 2004. In addition, the ratio of medical care as well as that of reading & recreation exhibited a tendency to increase. (Figure I-2)
Figure I-2: Changes in the Components of Average Monthly Living Expenditures
(All Households)
(iii) Comparison of Living Expenditures over the Previous Survey by Item
Looking at the real rates of increase/decrease in living expenditures over the previous survey per household in all households, food decreased at an annual rate of 1.5%. Although cooked food increased, meat, fish & shellfish, eating out, cereals and vegetables & seaweed decreased resulting in an overall decrease.
Housing decreased at an annual rate of 1.9%. Specifically, the rents for dwelling and land recorded a marked drop and the repair & maintenance of equipment also became lower.
At the same time, fuel, light & water charges fell at an annual rate of 0.6%. Gas, water & sewerage and other items decreased except for electricity.
On the other hand, furniture & household utensils showed an increase at an annual rate of 0.7%. While interior furnishings & decorations was reduced, household durables posted a marked increase of 4.6% and household consumables also edged up resulting in an overall increase.
Clothes & footwear showed a decline at an annual rate of 2.5%. All related items including footwear, clothing, shirts & sweaters were reduced as well.
Medical care rose at an annual rate of 2.5%. All related items including medical supplies & appliances, medical services also expanded.
Transportation & communication rose at an annual rate of 2.6%. While public transportation was curtailed, payment for communication bills showed a significant increase of 7.4% and private transportation was on the rise resulting in an overall expansion.
Education decreased at an annual rate of 1.4%. All items including tutorial fees and school fees shrank.
Reading & recreation expanded at an annual rate of 2.0%. Specifically, recreational durable goods recorded a notable increase of 16.6% and all other related items including recreational services, reading & recreation items, books & other reading materials edged up.
"Other living expenditures" decreased at an annual rate of 1.5% in nominal terms. While miscellaneous expenditures grew, remittance and social expenses were curtailed resulting in an overall decrease. (Figure I-3)
Figure I-3: Changes in Annual Rate of Increase/Decrease in Average Monthly Living Expenditures by Item over Previous Survey (All Households)
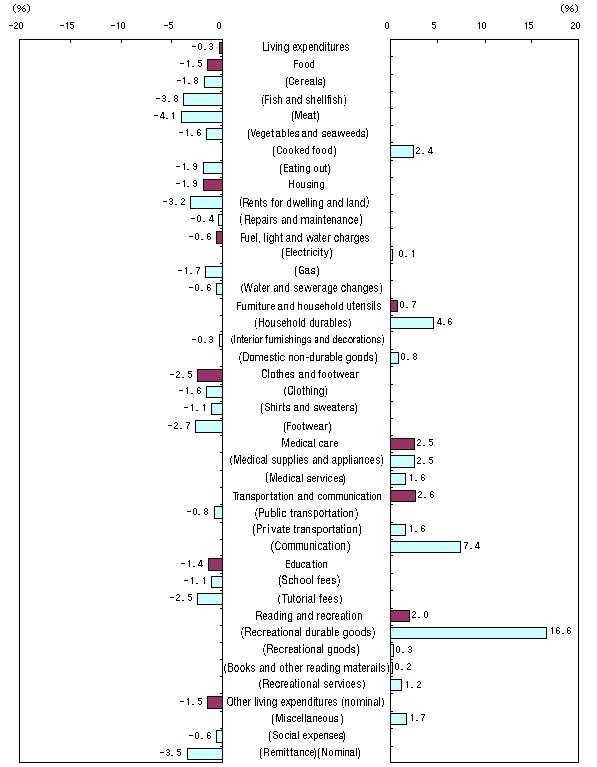
Note: Social expenses are quantified by "General Expenses Excluding Attributable Rent"
since there is no corresponding item in consumer price index.
Go to I-2 Outstanding Savings and Liabilities
![]()
![]()