Main contents start here

Summary of Results Concerning "Family Income and Expenditure" and "Savings and Liabilities"(Two or More Person Households)
Released on December 26, 2000
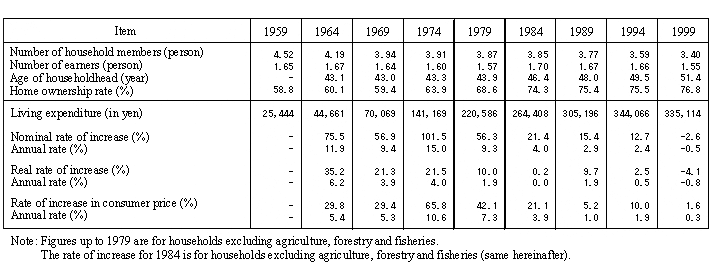
1. Monthly living expenditure averages 335,114 yen per household, declining for the first time since the start of the survey
- Monthly average living expenditure per household amounted to 335,114 yen between September and November 1999 for all households.
- Compared with the previous survey (1994), monthly average living expenditure per household fell (-)2.6% on a nominal basis and (-)4.1% on a real basis, which excludes the increase in consumer prices, marking the first decline since the start of the survey.
- The number of members per household decreased from 3.59 persons in 1994 to 3.40 persons in 1999. This translates into a real increase of (+)1.2% in living expenditure per capita.
Figure 1 Trends in Rate of Increase in Monthly Average Living Expenditure from Previous Survey (All Households)
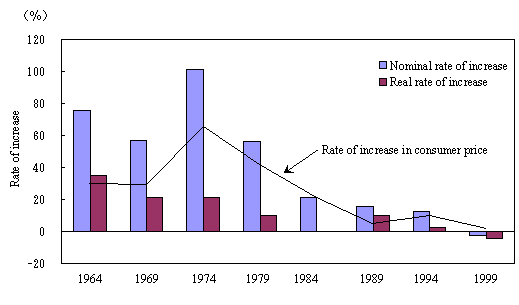
Table 1 Trends in Monthly Average Living Expenditure (All Households)
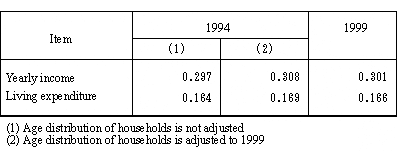
2. Income disparity is widening somewhat due to aging of population
- An examination of the disparity in yearly income between households by means of Gini's coefficient reveals a slight rise to 0.301 in 1999.
- A look at the disparity in living expenditure between income groups by means of pseudo-Gini's coefficient shows an upturn to 0.166 in 1989, a drop to 0.164 in 1994, a rebound to the same level as 1989 (0.166) in 1999.
- A comparison with 1994 figures by age group of household head indicates that Gini's coefficient of yearly income and pseudo-Gini's coefficient of living expenditure edged up slightly for young age group under 30 years old but took a downturn for old age group in their 60s and 70 years or older.
- If the effects of changes in the age composition of household head resulting from the aging of the population are omitted, both Gini's coefficient of yearly income and pseudo-Gini's coefficient of living expenditure fall slightly below 1994 figures.
Note: Gini's coefficient indicates the degree of concentration or non-uniformity of distribution, with distribution becoming more uniform as the coefficient approaches 0 and distribution becoming more non-uniform as the coefficient approaches 1. Pseudo-Gini's coefficient measures the disparity between income groups by arranging income in order and applying the same computation method as Gini's coefficient.
Table 2 Trends in (Pseudo) Gini's Coefficient of Yearly Income and Living Expenditure (All Households)
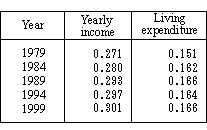
Table 3 (Pseudo) Gini's Coefficient of Yearly Income and Living Expenditure by Age Group of Household Head (All Households)
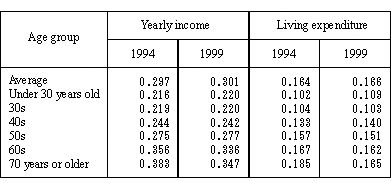
Table 4 (Pseudo) Gini's Coefficient of Yearly Income and Living Expenditure for the Case that the Age Distribution of Household Head is Adjusted (All Households)
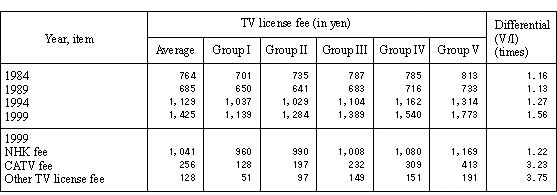
3. Information- and communication-related disbursements ballooned. The disparity in disbursements on the purchase of personal computers and word processors contracted while telephone charges and TV license fees widened
- Compared with 1994, disbursements on personal computers and word processors soared (+)161.3% while telephone charges jumped (+)53.4% and TV license fees climbed (+)26.2%.
- A look at disbursements on the purchase of personal computers and word processors by yearly income quintile group shows that the disparity between Group I and Group V (Group V/Group I) is 4.76 times. This represents a contraction from 1994 (6.11 times).
- An examination of disbursements on telephone charges indicates that the disparity between Group I and Group V is 1.75 times, registering an increase from 1994 (1.57 times).
- If telephone charges are divided into stationary telephone charges and mobile phone charges, the disparity between Group I and Group V stands at 1.69 times and 1.97 times, respectively.
- An observation of disbursements on TV license fees suggests that the disparity between Group I and Group V stands at 1.56 times, widening since 1989.
- A look at the breakdown of TV license fees reveals that the disparity in NHK fees between Group I and Group V is a paltry 1.22 times while the disparity in CATV fees is 3.23 times, and the disparity in other TV license fees is large at 3.75 times.
Table 5 Trends in Disbursements on Purchase of Personal Computers and Word Processors by Yearly Income Quintile Group (All Households)
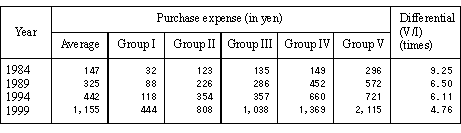
Table 6 Trends in Telephone Charges by Yearly Income Quintile Group (All Households)
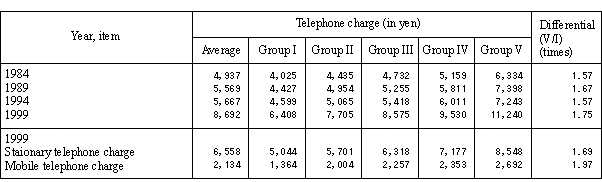
Table 7 Trends in TV License Fees by Yearly Income Quintile Group (All Households)
4. Income of double-income households is up (+)2.0% on a real basis but down (-)0.7% on a real basis for households in which household head is the sole earner
- Monthly average income of double-income households amounted to 620,567 yen, a real increase of (+)2.0% from 1994.
- Income consisted of 409,788 yen in wage and salary income of the household head (66.0% of income) and 140,252 yen in wage and salary income of the spouse of household head (22.6% of income), among other income.
- Income of households in which household head is the sole earner was down (-)0.7% on a real basis from 1994. As a result, the gap with double-income households widened.
- Monthly average living expenditure came to 383,775 yen, a real decrease of (-)1.2% from 1994. Assuming that living expenditure of households in which household head is the sole earner was 100, living expenditure of double-income households stood at 121.4. As a result, the gap widened from 1994 (118.7).
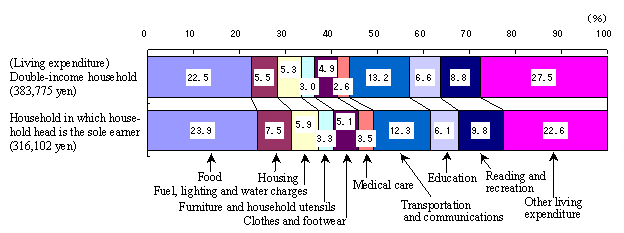
- An examination of the proportion of disbursements in living expenditure by expense item indicates that double-income households have a higher proportion of "other living expenditure", such as social expenses, transportation and communication expenses and educational expenses, but a lower proportion of housing, food, and reading and recreation expenses than households in which household head is the sole earner.
Table 8 Trends in Monthly Average Income and Living Expenditure of Double-Income Households and Households in which Household Head is the Sole Earner (Workers' Households)
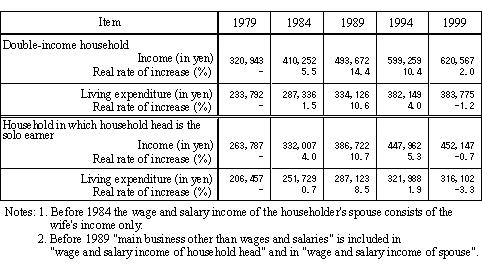
Figure 2 Expense Item Composition of Monthly Average Living Expenditure of Double-Income Households and Households in which Household Head the Sole Earner (Workers' Households)
5. Outstanding liabilities ballooned in all age groups of 40s age group or below, liabilities exceeded savings for the 30s age group
- Outstanding savings per household came to 14.85 million yen, up (+)8.9% from 1994, while outstanding liabilities amounted to 5.67 million yen, up (+)16.6%.
- Outstanding savings by age group of the household head increase as the age group goes up, amounting to 3.73 million yen for households headed by people under 30 years old and 22.68 million yen for those aged 70 or older. Those in their 40s had the largest amount of outstanding liabilities of 8.45 million yen.
- Compared with 1994, outstanding savings diminished in all age groups under 40s age group. Meanwhile, outstanding liabilities increased in all age groups except 70 years or olders. In particular, outstanding liabilities surged more than (+)30% among those under 30 years old and those in their 30s and 40s.
- In the 30s age group, outstanding liabilities exceeded outstanding savings for the first time since the start of the survey.
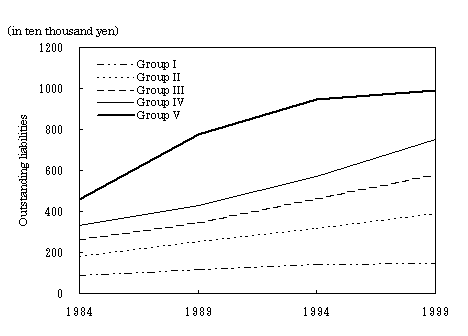
- A look at outstanding liabilities by yearly income quintile group shows that outstanding liabilities amounted to 1.45 million yen in Group I and to 9.89 million yen in Group V and the disparity between Group I and Group V stood at 6.80 times.
- An examination of the trends in outstanding liabilities reveals that outstanding liabilities soared in Group V in 1989 but thereafter the rate of increase for Groups II-IV surpassed that for Group V. In 1999 Groups II-IV registered a growth of upwards of (+)20%. Group I and Group V recorded low growth of (+)3.2% and (+)4.2%, respectively.
Figure 3 Outstanding Savings and Outstanding Liabilities by Age Group of Household Head (All Households)
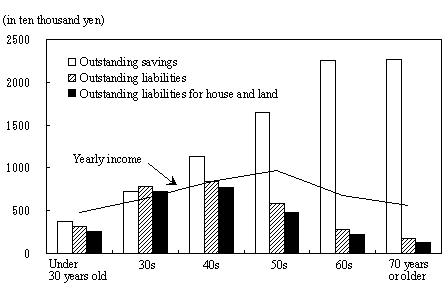
Figure 4 Trends in Outstanding Liabilities by Yearly Income Quintile Group (All Households)
6. Average propensity to consume for households with housing loans fell significantly compared with that for households without housing loans
- Disposable income of households with housing loans edged up (+)0.4% on a real basis from 1994 while living expenditure contracted (-)5.0%. These figures are lower than the real rates of increase for households without housing loans (+)0.9%, (-)1.2%).
- Average propensity to consume stood at 73.4% for households with housing loans and at 80.7% for households without housing loans, down (-)4.2 percentage points and (-)1.7 percentage points, respectively, from 1994. The decrease for households with housing loans was substantial.
- Housing loan repayments for households with housing loans amounted to 64,646 yen, with the proportion of housing loan repayments (the proportion of housing loan repayments in disposable income) standing at 12.9%. Compared with 1994, housing loan repayments expanded (+)18.0% while the proportion of housing loan repayments edged up (+)1.7 percentage points.
- The net rate of increase in financial assets of households with housing loans (the proportion of the amount of net increase in financial assets in disposable income) was 9.5%, up (+)1.3 percentage points from 1994. On the other hand, the rate of net increase in financial assets of households without housing loans came to 14.4%, down (-)0.1 percentage point.
Table 9 Monthly Average Income and Living Expenditure by Existence of Housing Loans (Workers' Households)
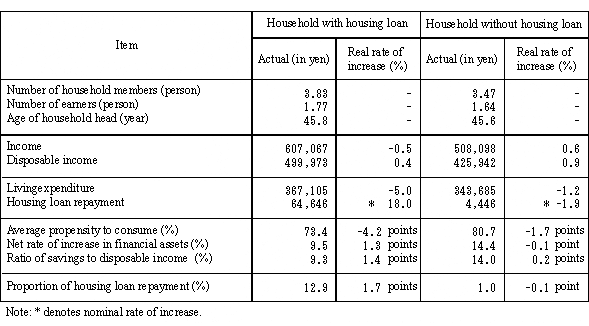
Households with housing loans mean households with outstanding housing and land loans of 10,000 yen or more as of the end of November 1999; otherwise, they are referred to as households without housing loans (same hereinafter).
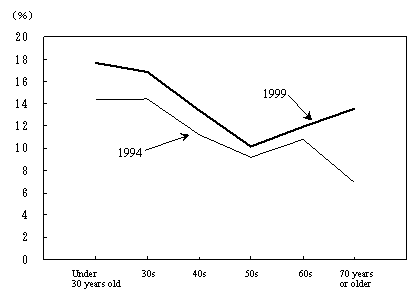
7. The proportion of housing loan repayments is rising significantly among young age group
- The proportion of households with housing loans by age group of household head has a correlation with the home ownership rate up to the 40s age group. The correlation becomes stronger as the age group rises. The home ownership rate is constant on the whole at around 85% for households headed by people aged 50 or older but the proportion of households with housing loans drops as the age group rises.
- The amount of housing loan repayment by households with housing loans came to about 60,000-70,000 yen for all age groups. The disparity between different ages is relatively small.
- The proportion of housing loan repayments varies considerably depending on age since it is affected by the level of disposable income. The proportion is high at around 17% for young age group.
- The proportion of housing loan repayments rose in all age groups from 1994. In particular, the proportion soared among those aged 70 years or older and young age group.
Figure 5 Home Ownership Rate and Proportion of Households with Housing Loans by Age Group of Household Head (Workers' Households)
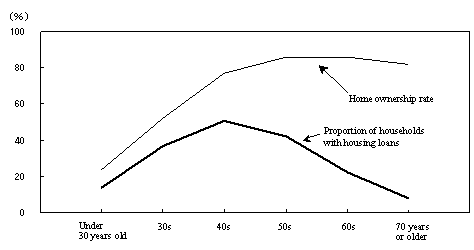
Figure 6 Proportion of Housing Loan Repayments by Households with Housing Loans by Age Group of Household Head (Workers' Households)
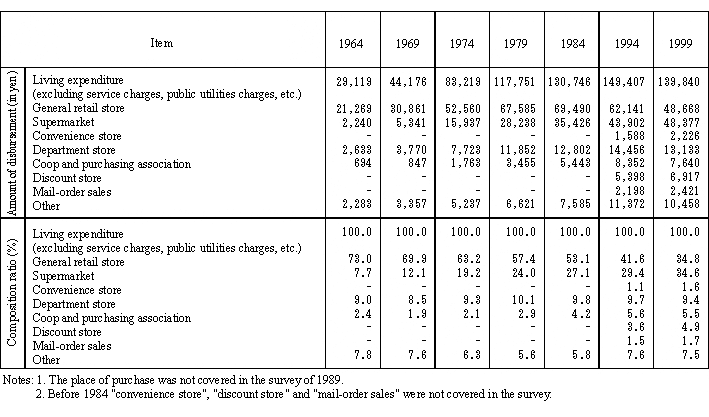
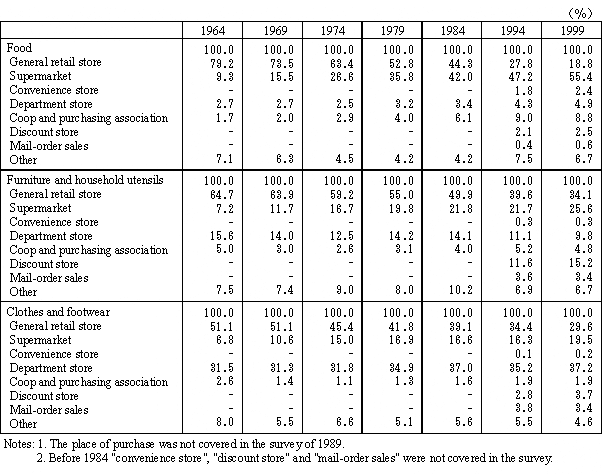
8. The proportion of purchase at general retail stores and department stores is declining while the proportion of purchase at supermarkets, convenience stores and discount stores is rising
- A look at the proportion of living expenditure excluding service charges by place of purchase indicates that general retail stores account for the largest proportion of 34.8%, followed by supermarkets with 34.6%, department stores with 9.4%, coops and purchasing associations with 5.5%, discount stores with 4.9%, mail-order sales with 1.7%, and convenience stores with 1.6%.
- An examination of the trends in the proportion of disbursements by place of purchase shows that purchase at general retail stores is decreasing continuously while purchase at supermarkets is taking a continuous upturn. Meanwhile the proportion of disbursements at general retail stores and supermarkets is almost the same. The proportion of purchase at department stores topped 10% in 1979 but thereafter has continued to follow a downtrend. The figure for coops and purchasing associations continued rising from 1969 through 1994 and dropped slightly in 1999. The figure for convenience stores, discounts stores and mail-order sales was up from 1994.
Table 10 Trends in Disbursements in Living Expenditure by Place of Purchase (All Households)
9. The proportion of purchase of food, clothes and footwear at department stores is expanding
- Regarding living expenditure excluding service charges, the proportion of purchase of food at general retail stores continued to take a downturn. By contrast, the proportion of purchase at supermarkets climbed continuously and the proportion of purchase at department stores also followed an uptrend. Although purchases at coops and purchasing associations advanced continuously up to 1994, they declined in 1999. On the other hand, purchases at convenience stores were up.
- Purchases of furniture and household utensils at general retail stores fell continuously. Likewise, purchases at department stores also followed a downtrend. However, purchases at supermarkets took an upswing with the exception of a slight decrease in 1994. Purchases at discount stores are rising, and a comparison with other expense items reveals a high proportion of purchase at discount stores.
- Purchases of clothes and footwear at general retail stores continue to decline. Meanwhile purchases at department stores contracted in 1994 but rebounded in 1999. Purchases at supermarkets followed an uptrend up to 1979, continued falling thereafter but made a resurgence in 1999. Purchases at discount stores advanced. Purchases at mail-orders sales dwindled. A comparison with other expense items shows that the proportion of purchase at department stores is high.
Table 11 Proportion by Expense Item and Place of Purchase (All Households)
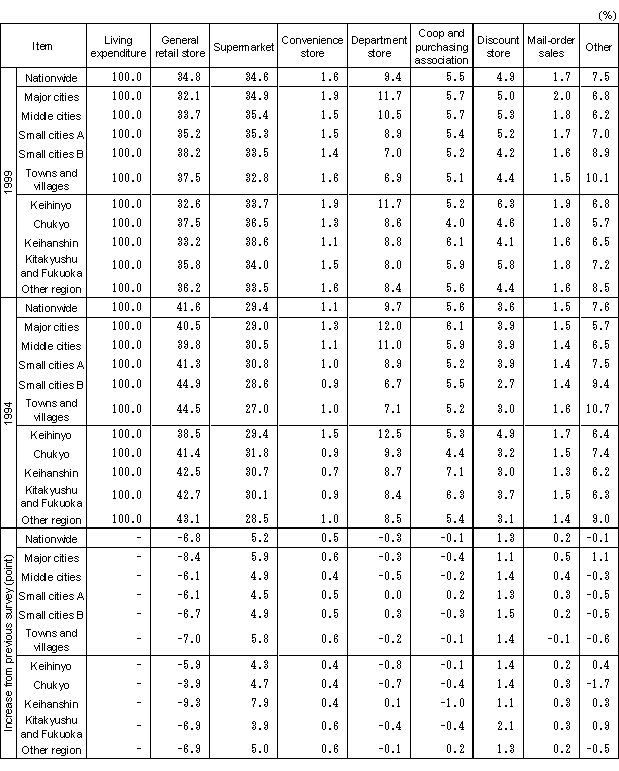
10. Disbursements at supermarkets surpass those at general retail stores in major cities, middle cities, the Keihinyo metropolitan area and the Keihanshin metropolitan area
- Regarding living expenditure excluding service charges, an examination of the proportion of purchase by city group indicates that the proportion for general retail stores tends to drop as the population of the city group becomes larger. On the other hand, the proportion for department stores rises as the population of the city group becomes larger. The proportion for coops and purchasing associations and mail-order sales is somewhat low for city groups with a small population. The proportion for convenience stores is somewhat high in major cities and almost identical in other city groups. The proportion for supermarkets and discount stores is higher in middle cities and small cities A than in major cities.
- In the Keihinyo metropolitan area, the proportion of purchase at department stores, discount stores, convenience stores and mail-order sales is high. In the Chukyo metropolitan area, the proportion for general retail stores is large, and in the Keihanshin metropolitan area, the proportion for supermarkets, coops and purchasing associations is substantial.
- Compared with 1994, the proportion for general retail stores slipped 4-9 percentage points in all city groups and metropolitan areas while the proportion for supermarkets was up 4-8 percentage points in all city groups and metropolitan areas. The proportion for supermarkets was higher than that for general retail stores in major cities, middle cities, small cities A, the Keihinyo metropolitan area, and the Keihanshin metropolitan area. Whereas the proportion for department stores went up slightly in small cities B and the Keihanshin metropolitan area, it edged down more than 0.5 percentage point in the Keihinyo metropolitan area and the Chukyo metropolitan area.
Table 12 Proportion of Living Expenditure by City Group and Metropolitan Area and by Place of Purchase (All Households)
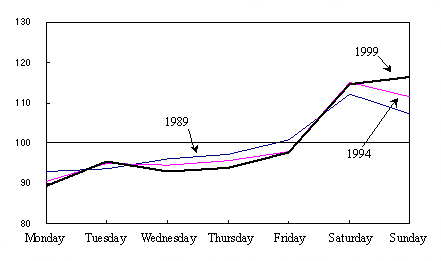
11. The proportion of disbursements on Sundays moved up while the proportion on Saturdays and weekdays went down. Disbursements on food, furniture and household utensils on Sundays surpass those on Saturdays
- An examination of living expenditure by day of the week by means of the expenditure index whose average for all days of the week (excluding national holidays) is 100 shows that the index is the highest on Saturdays at 114.7, followed by 112.8 on Sundays, and 94.5 on weekdays.
- The proportion of disbursements on weekdays stands at 67.5% if total disbursements from Monday to Friday are obtained, accounting for roughly two-thirds of the total.
- An observation of the expenditure index by day of the week reveals an uptrend in the expenditure index on Saturdays from 1989 through 1994 and an uptrend in the index on Sundays in 1999. Although the index continues to fall on weekdays, the rate of decline is moderate.
- By expense item, disbursements on food, furniture and household utensils on Saturdays were greater than those on Sundays in 1994 but disbursements on Sundays exceeded those on Saturdays in 1999.
Figure 7 Expenditure Index by Day of Week of Living Expenditure (All Households)
Average for all days of week (excluding national holidays) = 100
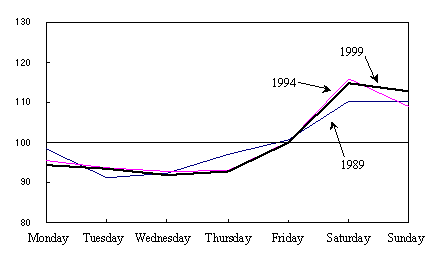
Figure 8 Expenditure Index of Food by Day of Week (All Households)
Average for all days of week (excluding national holidays) = 100
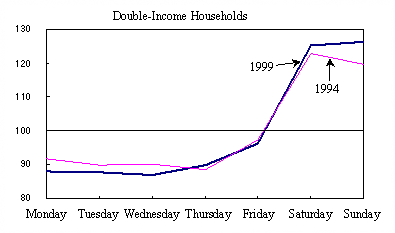
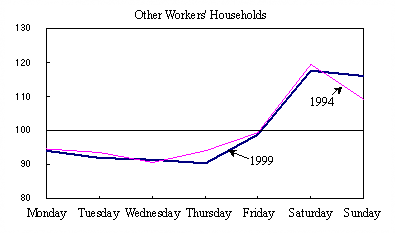
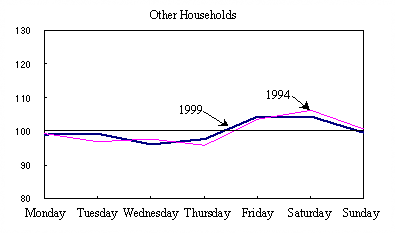
12. Double-income households for which the proportion of disbursements on weekends increased and other households for which the proportion of disbursements on weekends declined
- A look at the expenditure index of double-income households, other workers' households and other households by day of the week shows a significant disparity between Saturdays and weekdays and between Sundays and weekdays for double-income households and a small disparity for other households.
- Compared with 1994, the index fell on weekdays but rose on weekends for double-income households. Meanwhile, the index was down on weekdays and Saturdays but up on Sundays for other workers' households. The index inched up on weekdays but declined on weekends for other households.
Figure 9 Expenditure Index by Occupation of Household Head and Status of Employment of Spouse and by Day of Week of Living Expenditure
Average for all days of week (excluding national holidays) = 100
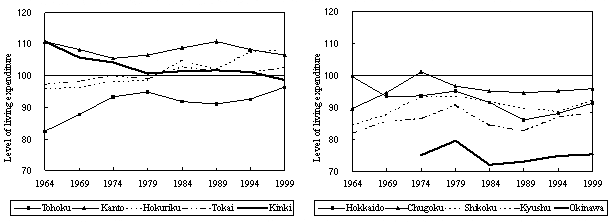
13. Disparity in living expenditure between prefectures is contracting. Nominal increase was registered in Hokkaido, Tohoku and Shikoku, and downtrend continued in Kanto and Kinki districts.
- Living expenditure per household for all households by prefecture, assuming that the national average is 100, was the highest for Toyama Prefecture at 119.3, followed by Ibaraki Prefecture, Ishikawa Prefecture, Kanagawa Prefecture, Gifu Prefecture and Fukui Prefecture. On the other hand, the lowest level was registered in Okinawa Prefecture at 75.4, followed by Miyazaki Prefecture, Kagoshima Prefecture, Kumamoto Prefecture, Aomori Prefecture and Kochi Prefecture.
- An examination of the disparity in living expenditure per household between prefectures by means of the standard deviation of the index with a value of 100 for the national average indicates a drop in the disparity from 9.8 in 1994 to 8.9 in 1999.
- A look at living expenditure per household by district, assuming the national average is 100, shows that the largest living expenditure was registered in the Hokuriku district at 108.2, followed by the Kanto, Tokai and Kinki districts. The lowest living expenditure, on the other hand, was recorded in Okinawa district at 75.4, followed by Kyushu, Hokkaido and Shikoku districts.
- Compared with 1994, Hokkaido, Tohoku and Shikoku posted a nominal increase of (+)1.1% , (+)1.3%, and (+)1.2%, respectively. Other districts registered a nominal decrease. In particular, the Kinki district recorded the largest decline of (-)5.2%.
- An observation of the level of living expenditure for each district since 1989 with 100 as the national average indicates that the level took a downturn in the Kanto, Tokai, Kinki and Shikoku districts from 1989 through 1994 but declined only in the Kanto and Kinki districts in 1999.
Table 13 Trends in Standard Deviation of Monthly Average Living Expenditure (All Households)
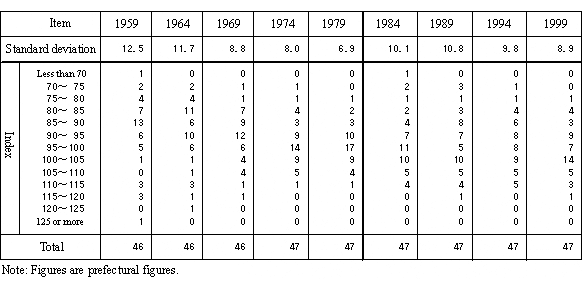
Figure 10 Trends in Level of Living Expenditure by District (All Households)
national average = 100
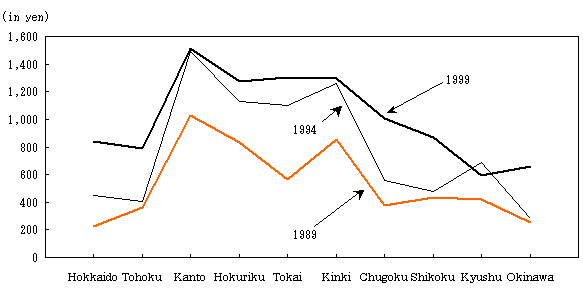
14. Personal computer and word processor purchasing expenses expanded in large urban areas. Overseas package tour expenses increased in regions other than large urban areas
- Personal computer and word processor purchasing expenses in the Kinki, Chugoku, Kanto and Tokai districts were higher than the national average. Meanwhile, expenses in Tohoku, Okinawa, Kyushu, Shikoku, Hokkaido and Hokuriku fell below the national average.
- Although the disparity in personal computer and word processor purchasing expenses was marginal in 1994, such expenses in the districts which includes three major metropolitan areas of Keihinyo (Kanto district), Chukyo (Tokai district) and Keihanshin (Kinki district) tended to be large in 1999.
- Overseas package tour expenses were the largest in the Kanto district, followed by the Tokai and Kinki districts. Such expenses are growing in the districts which includes three major metropolitan areas. Meanwhile, such expenses were the lowest in Kyushu, followed by Okinawa, Tohoku and Hokkaido.
- Although overseas package tour expenses ballooned in the Kanto, Tokai and Kinki districts, which include three major metropolitan areas, from 1989 through 1994, growth in these districts was anemic between 1994 and 1999. By contrast, significant growth was registered in Hokkaido, Tohoku, Chugoku, Shikoku and Okinawa.
Figure 11 Personal Computer and Word Processor Purchasing Expenses by District (All Households)
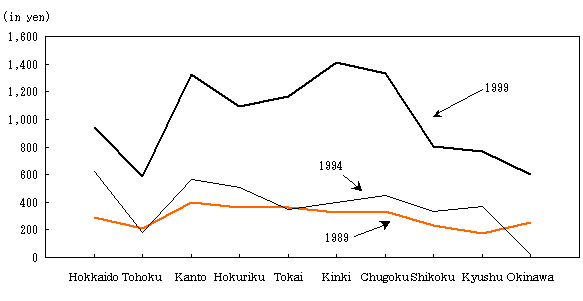
Figure 12 Overseas Package Tour Expenses by District (All Households)
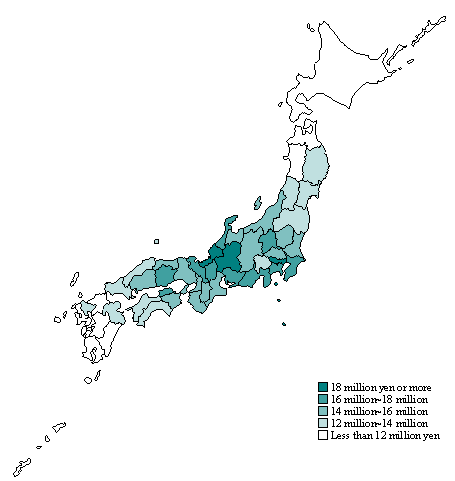
15. Outstanding savings were the largest in Fukui Prefecture, amounting to 19.45 million yen
- An examination of outstanding savings per household by prefecture indicates that Fukui Prefecture had the largest savings of 19.45 million yen, followed by Tokyo, Gifu Prefecture, Ishikawa Prefecture, Kanagawa Prefecture and Kagawa Prefecture. On the other hand, Okinawa Prefecture had the smallest savings of 5.79 million yen, followed by Aomori Prefecture, Akita Prefecture, Miyazaki Prefecture, Kagoshima Prefecture and Kumamoto Prefecture.
Figure 13 Outstanding Savings by Prefecture (All Households)
![]()
![]()