Main contents start here
2002 National Survey of Prices: Summary of Results (Bargain prices)
2 Discount rates applied for bargains
- The discount rates applied for bargains tend to be high in the case of large-scale supermarkets and small-scale supermarkets, while they tend to be low in the case of small-scale general retail outlets.
- At large-scale supermarkets and small-scale supermarkets, the discount rates for edible oil, sugar, hen eggs, etc. tend to be high while the discount rate for fresh milk tends to be low.
- In the case of small-scale general retail outlet, the discount rates applied for bargains increased compared to those of the 1997 survey.
Chart 2-1 demonstrates, with regard to foodstuffs for which the bargaining rate tends to be higher than that for convenience goods, the discount rates applied to bargains per item by each type of outlet.
(1) The discount rates tend to be high in the case of ?large-scale supermarket? and ?small-scale supermarket?, while they tend to be low in the case of ?small-scale general retail outlet?.
(2) Taking a look by item, at ?large-scale supermarket? the discount rate for ?edible oil? (45.7%) is the highest, and followed by ?sugar? (43.9%), ?hen eggs? (42.3%), ?soy sauce? (40.3%), etc.
In the case of ?small-scale supermarket?, the discount rate for ?sugar? (45.9%) is the highest, and followed by ?edible oil? (43.7%), ?soy sauce? (42.5%), ?hen eggs? (41.9%), etc.
At ?small-scale general retail outlet? the discount rates for ?edible oil? and ?sugar? are the highest at 27.6%, and those for other items are around 15 to 25%.
In addition, for ?fresh milk?, its bargaining rate is the highest in the case of ?large-scale supermarket? and ?small-scale supermarket?, but its discount rate is the lowest, 15.2% and 17.1% respectively.
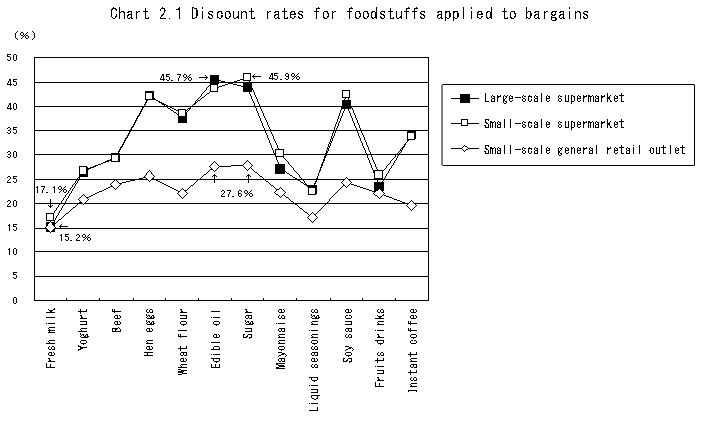
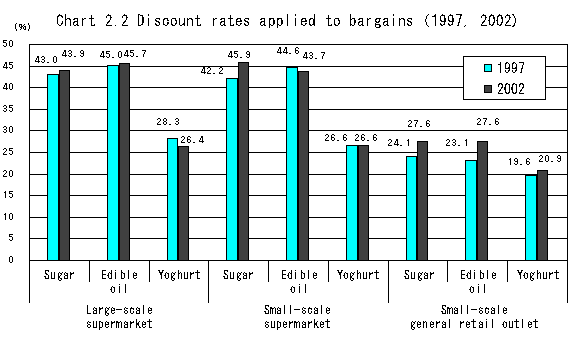
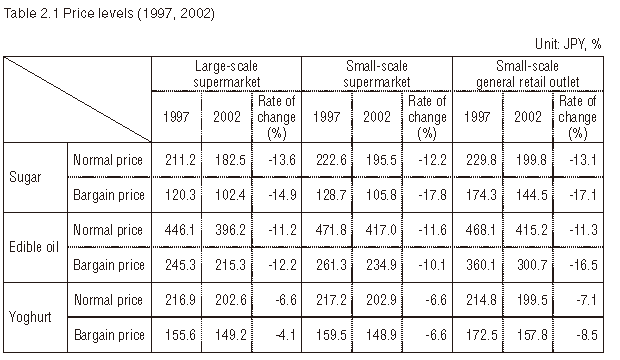
Chart 2-2 shows comparisons of discount rates applied to bargains per item with the results of the previous survey of 1997, selecting the items ?sugar?, ?edible oil? and ?yoghurt? for which bargaining rates are high among comparable items, in order to study how the discount rates applied to bargains have changed compared to those of the last survey (the survey results of 1997). In addition, Table 2-1 demonstrates the change of price levels shown in Chart 2-2 per item by type of outlet.
(3) Compared to discount rates applied to bargains which are derived from the survey results of 1997, the rates remain almost unchanged or decreased at ?large-scale supermarket?, and they remain almost unchanged or increased at ?small-scale supermarket?, while they have increased in all of the items at ?small-scale general retail outlet?.
(4) Normal prices and bargain prices are lower than those of 1997 for all items as well as for all types of outlet. The rates of change of normal prices are - 12.2% to -13.6% for ?sugar?, - 11.2% to -11.6% for ?edible oil? and -6.6% to -7.1% for ?yoghurt?. On the other hand, the rates of change of bargain prices are -14.9% to -17.8% for ?sugar?, - 10.1 to -16.5% for ?edible oil? and -4.1% to 8.5% for ?yoghurt?. Differences in the rate of change of bargain prices among the types of outlets are larger than those in the rate of change of normal prices; it is found that differences in the change of discount rates among the types of outlet depend mainly on the change of bargain prices.
![]()
![]()