Main contents start here
4. Income
Income by Industry
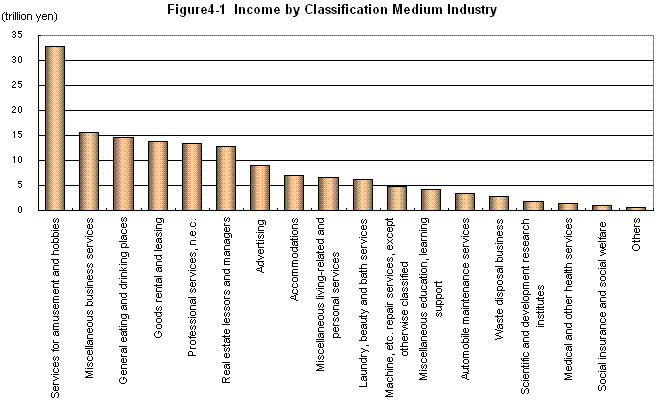
Amount of income for "Services for amusement and hobbies" is about 32,700 billion yen
The amount of income for the entire service industry in fiscal 2003 was 151,815.9 billion yen*. Breaking this down into classification medium industry, the highest amount of income is 32,726.5 billion yen, for "Services for amusement and hobbies", followed by 15,517.8 billion yen for "Miscellaneous business services" such as building maintenance services and worker dispatching services, and 14,604.2 billion yen for "General eating and drinking places".
In addition, with reference to the type of legal organization, "Individual proprietorships" accounted for 13,012.0 billion yen, while "Companies" accounted for 138,803.9 billion yen.
*With regard to income, establishments that are "Individual proprietorships" or "Companies" are surveyed. Hereinafter mentioned as same
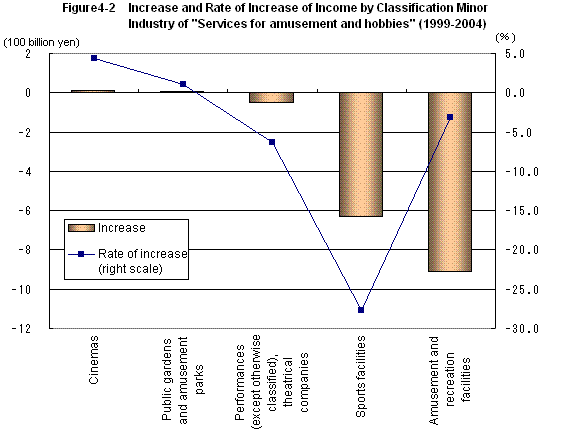
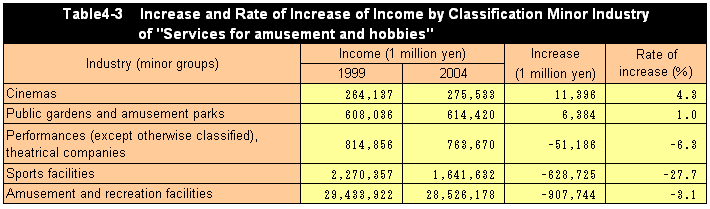
Amount of Increase and Rate of Increase of Income by Classification Minor Industry
Incomes of "Amusement and recreation facilities" such as "Pachinko" parlors and "Sports facilities" decrease drastically
The highest income category is "Services for amusement and hobbies". Comparing the classification minor industry with those of 1999, "Amusement and recreation facilities" such as "Pachinko" parlors, which had the highest income in the "Services for amusement and hobbies" category, decreased 907.7 billion yen (a 3.1% decrease), while "Sports facilities" decreased 628.7 billion yen (a 27.7% decrease). In contrast, "Cinemas" increased 11.4 billion yen (a 4.3% increase), while "Public gardens and amusement parks" increased 6.4 billion yen (a 1.0% increase).
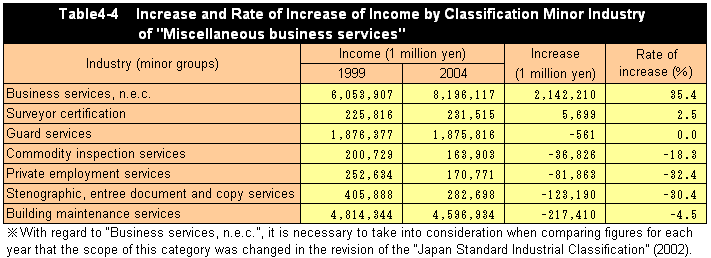
Income of "Business services, n.e.c" such as Worker dispatching services, increased drastically
The second highest income is for "Miscellaneous business services", and comparing the classification minor industry of this category with those of 1999, "Business services, n.e.c" such as Worker dispatching services increased drastically.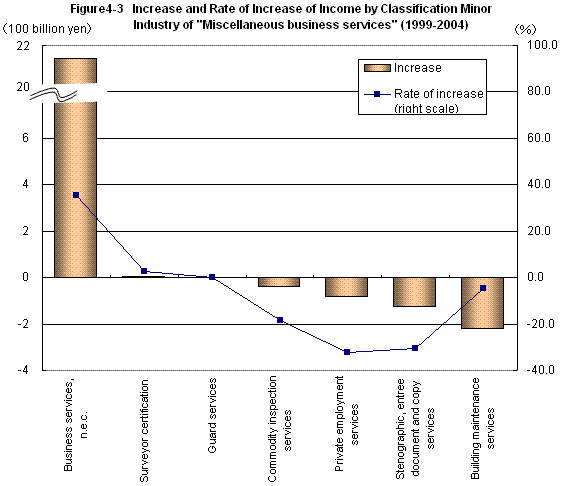
Income Ratio by Other Parties
Industries for individuals (general consumers) and industries for enterprises and associations mix in the service industry
With regard to income by other parties by classification medium industry, the highest income ratio from individuals (general consumers) is 99.9% of "Religion", followed by 97.6% of "Services for amusement and hobbies", 94.7% of "Miscellaneous education, learning support" such as Supplementary tutorial schools, and 94.4% of "General eating and drinking places". The highest income ratio from enterprises and associations is 99.9% of "Scientific and development research institutes", followed by 99.7% of "Advertising", 99.1% of "Video picture, sound information, character information production and distribution", and 96.5% of "Miscellaneous business services" such as Building maintenance services, or Worker dispatching services.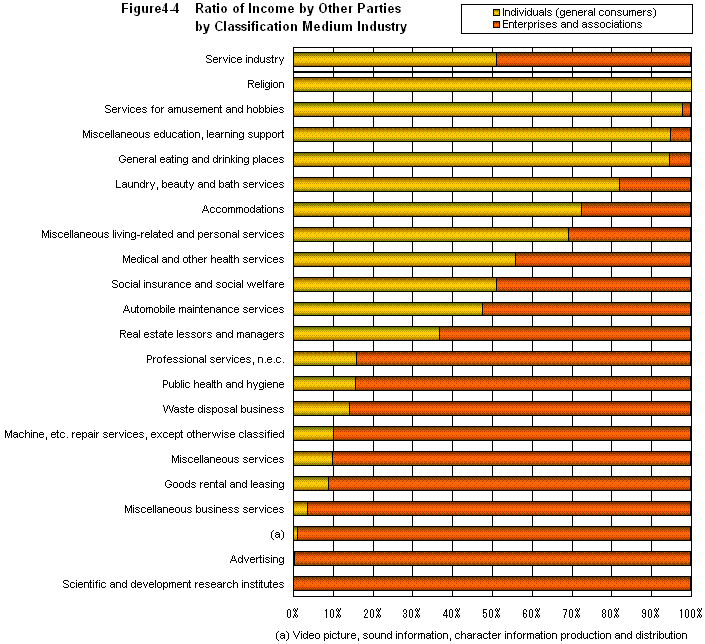
![]()
![]()