Main contents start here
![]()
2 Migration of Population by Prefecture
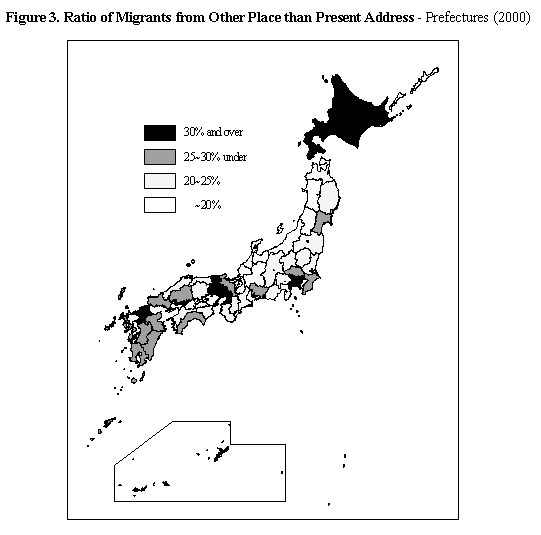
The ratio of migration exceeds 30 percent in seven prefectures, concentrated on regions such as Tokyo-to and Kanagawa-ken where major cities are located.
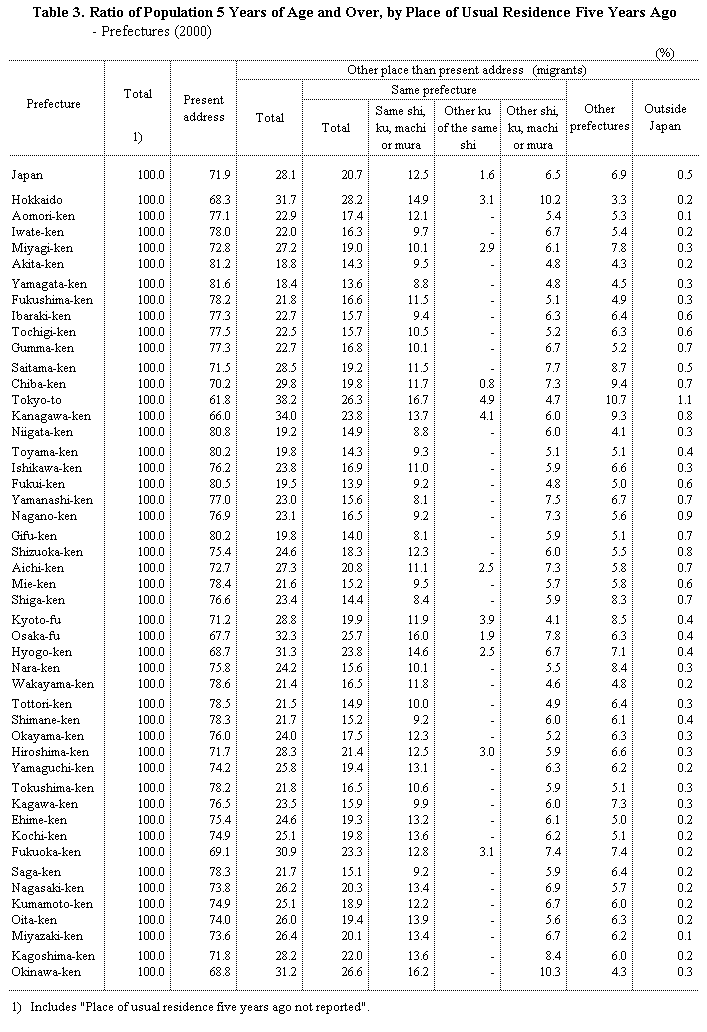
- A breakdown by prefecture of the ratio of those whose usual place of residence five years previously was different from their present address showed Tokyo-to to be the highest at 38.2 percent, followed by Kanagawa-ken (34.0 percent) and Osaka-fu (32.3 percent). Seven prefectures exceeded 30 percent, and generally prefectures containing major cities exhibited high ratios.
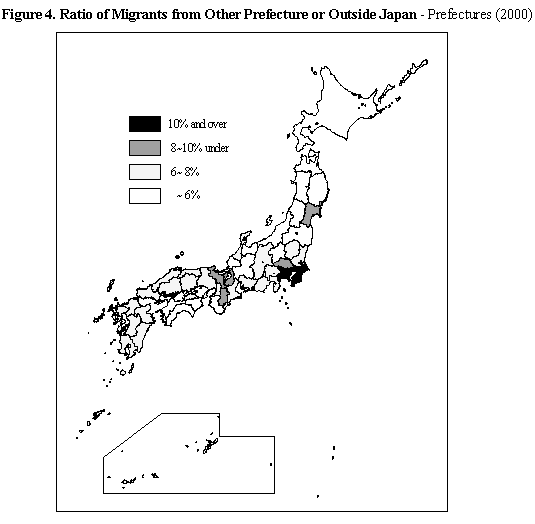
A breakdown of this by the usual place of residence of five years previously shows that the ratio of intra-prefectural migration was highest in Hokkaido at 28.2 percent, followed by Okinawa-ken (26.6 percent) and Tokyo-to (26.3 percent). For ratio of migration from other prefectures or overseas, Tokyo-to had the highest at 11.9 percent, followed by Kanagawa-ken (10.1 percent) and Chiba-ken (10.0 percent). Thus high ratios are observed in Tokyo-to and its neighboring prefectures. (Table 3, Figures 3 and 4)
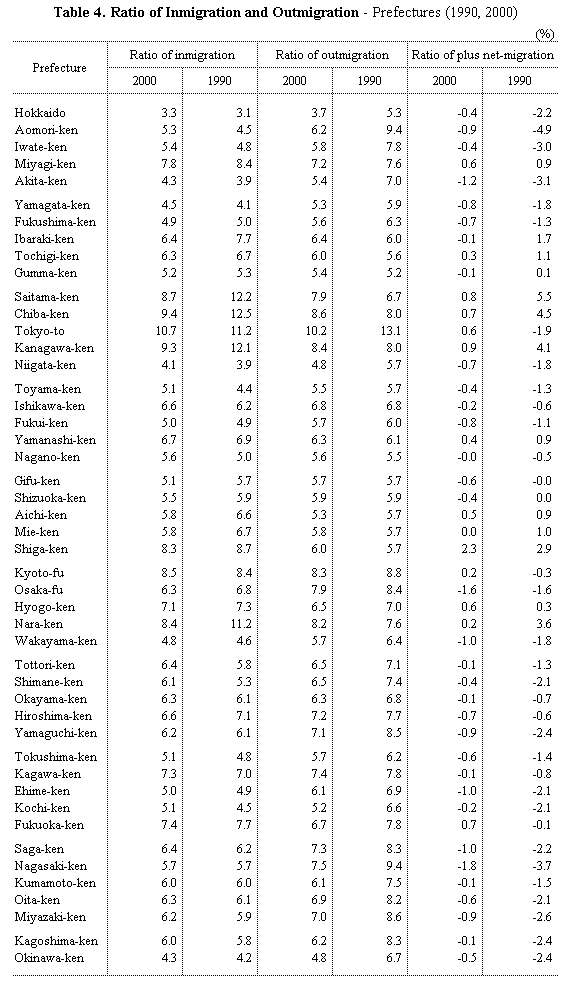
Ratios of both in-migration and out-migration are the highest in Tokyo-to.
- A breakdown of the ratio of in-migrants (those whose usual place of residence as of five years previously was in another prefecture) to the population aged five and over (in-migration ratio) in each prefecture shows that Tokyo-to was the highest at 10.7 percent, followed by Chiba-ken (9.4 percent) and Kanagawa-ken (9.3 percent). All these prefectures exceeded 9 percent.
On the other hand, low in-migration rates of below 5 percent were exhibited in five prefectures: Hokkaido at 3.3 percent being the lowest of all, followed by Niigata-ken (4.1 percent), Akita-ken and Okinawa-ken (both 4.3 percent).
- A breakdown of the ratio of out-migrants (those whose usual place of residence as of five years previously was in a stated prefecture but who are currently residing in another prefecture) to the population aged five and over (out-migration ratio) in each prefecture shows that Tokyo-to is the highest at 10.2 percent, followed by Chiba-ken (8.6 percent), Kanagawa-ken (8.4 percent), Kyoto-fu (8.3 percent), and Nara-ken (8.2 percent). All five of these prefectures have a ratio of over 8 percent.
On the other hand, a low out-migration rate were seen in Hokkaido, the lowest at 3.7 percent, followed by Niigata-ken and Okinawa-ken (both 4.8 percent). (Table 4)
Ratio of plus net-migration is highest in Shiga-ken, with Nagasaki-ken having the highest minus net-migration.
- A breakdown of the ratio of the difference between in-migrants and out-migrants (the difference between in- and out-migrations) to the population aged five and over (the ratio of excess between in- and out-migrations) in each prefecture shows that Shiga-ken was the highest at 2.3 percent in the plus net-migration, followed by Kanagawa-ken (0.9 percent), Saitama-ken (0.8 percent), Chiba-ken and Fukuoka-ken (both 0.7 percent), with 14 prefectures experiencing plus net-migration.
On the other hand, minus net-migration was exhibited in 33 prefectures including Nagasaki-ken (1.8 percent), Osaka-fu (1.6 percent), and Akita-ken (1.2 percent), and all the prefectures of the Chugoku and Shikoku regions. (Table 4)
1 Migration of Population by Sex and Age
![]()
![]()