Main contents start here
Detailed Sample Tabulation
1. Industry (minor groups)
1.1. Outline
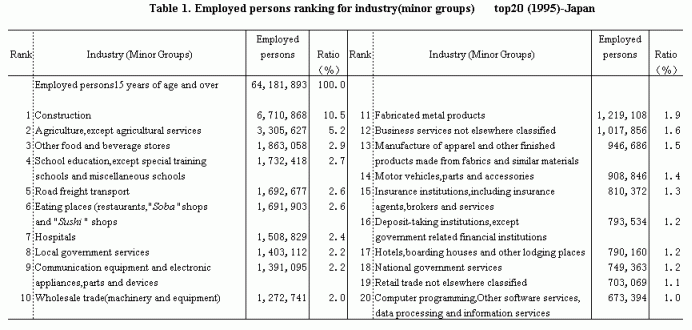
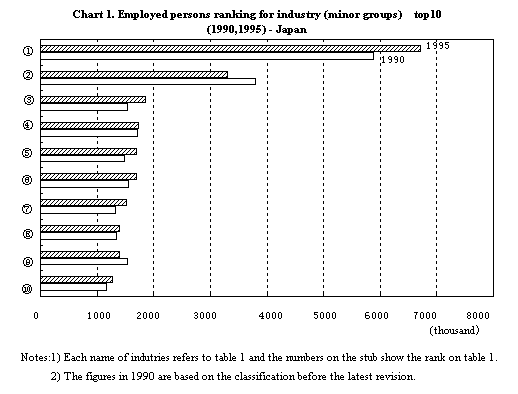
The total employed persons aged 15 and over in Japan was 64.18 millions. Looking at the employed persons by industry, "Construction" was the largest, 6.71 million persons or 10.5% of the total employed persons. "Agriculture, except agricultural services" was the second, 3.31 millions or 5.2%. "Other food and beverage stores" such as drugstores and lunch box shops was the third, 1.86 millions or 2.9%. In comparison with the previous census in 1990, "Road freight transport" increased outstandingly among the top 10 because of the increase of home delivery services and so on. Refer to Table 1 and Chart 1.
1.2. Increase rate in 1990-95
Looking at the increase rate in 1990-95 of the employed persons by industry except the industries which have less than 50,000 employed persons, "Other amusement and recreation services" was the highest, 78.2% because of the increase of karaoke bars and so on. "Welfare services for the aged" such as homes for the aged was the second, 73.7%. "Other social insurance and social welfare" such as institutes for physically handicapped persons was the third, 59.7%. Generally speaking, the industries belonging to "Services" showed higher increase rates. Refer to Table 2.
On the other hand, "Spinning mills, and twisting yarns and bulky yarns" was the lowest, -36.9%. "Woven fabric mills" was the second, -32.0%. "Garment sewing services and repairs" was the third, -25.5%. Generally speaking, the industries belonging to "Manufacturing" showed lower increase rates. Refer to Table 2.
2. Occupation (minor groups)
2.1. Outline
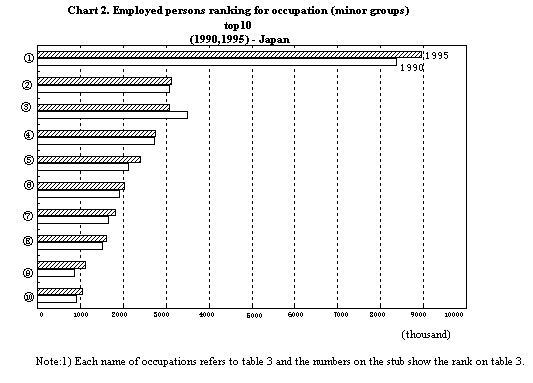
The total employed persons aged 15 and over in Japan was 64.18 millions. Looking at the employed persons by occupation, "General clerical workers" was the largest, 8.95 million persons or 13.9% of the total employed persons. "Shop salespersons and sales clerks" was the second, 3.12 millions or 4.9%. "Farmers and sericulturists" was the third, 3.08 millions or 4.8%. In comparison with the previous census in 1990, "Shop salespersons and sales clerks" increased outstandingly among the top 10. Refer to Table 3 and Chart 2.
2.2. Increase rate in 1990-95
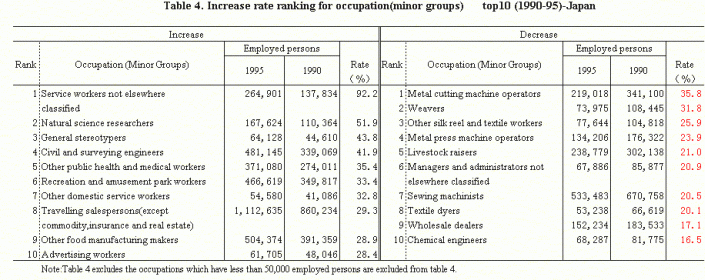
Looking at the increase rate in 1990-95 of the employed persons by occupation except the occupations which have less than 50,000 employed persons, "Service workers not elsewhere classified" such as beauticians for animals was the highest, 92.2%. "Natural science researchers" such as electronics researchers was the second, 51.9% because of the increase of the natural science institutes. "General stereotypers" was the third, 43.8%. Refer to Table 4.
On the other hand, "Metal cutting machine operators" was the lowest, -35.8% because of the decrease of the establishments belonging to "Fabricated metal products", "Manufacture of electrical machinery, equipment and supplies" and so on. "Weavers" was the second, -31.8%. "Other silk reel and textile workers" was the third, -25.9%. Generally speaking, the occupations belonging to "Craftsman, mining, production process and construction workers and labourers" showed lower increase rates. Refer to Table 4.
![]()
![]()