Main contents start here
Summary of the Results of Internal Migration in 2015
Released on April 28, 2016
![]() is "Portal Site of Official Statistics of Japan" (external site) where you can browse statistics tables and database.
is "Portal Site of Official Statistics of Japan" (external site) where you can browse statistics tables and database.
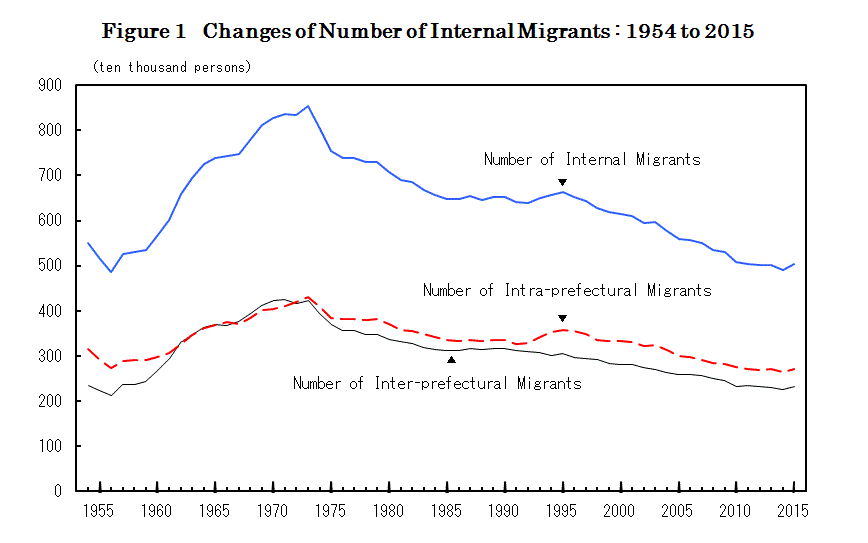
The number of inter-prefectural migrants has increased for the first time since 2011, the rate of migration was the first increase since 1995
- The number of Japanese internal migrants was 5,041,483 and the rate of migration was 4.04%, up 0.13 points from the previous year.
- The number of Japanese inter-prefectural migrants was 2,334,738, an increase for the first time since 2011. The rate of migration was 1.87%, up 0.07 points from the previous year. This was the first increase since 1995.
- The number of Japanese intra-prefectural migrants was 2,706,745 and the rate of migration was 2.17%, up 0.06 points from the previous year. This was the first increase since 2013.
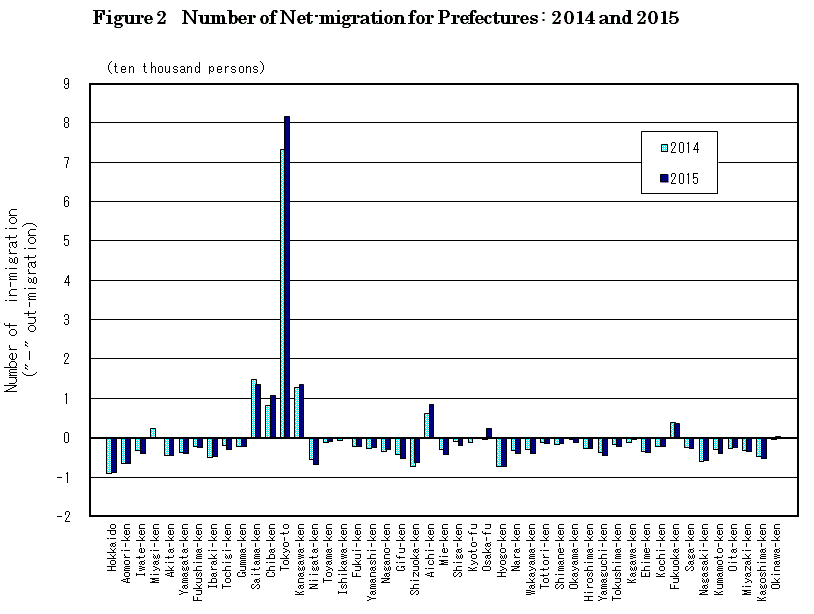
The number of positive net-migration for Tokyo-to had increased for the fourth straight year. Osaka-fu and Okinawa-ken had positive net-migration for the first time since 2013
- Regarding the net-migration for prefectures, eight prefectures had positive net-migration in 2015: Tokyo-to (81,696 persons), Saitama-ken (13,528 persons), Kanagawa-ken (13,528 persons), and so on. Among these prefectures, the net-migration in Osaka-fu and Okinawa-ken changed from negative to positive. Both prefectures had positive net-migration for the first time since 2013. The number of positive net-migration for Tokyo-to had increased for the fourth straight year, and the number for Saitama-ken was the first increase since 2012. The rate of positive net-migration in Tokyo-to (0.63%) was the highest, followed by Saitama-ken (0.19%), and so on.
- On the other hand, thirty-nine prefectures had negative net-migration in 2015: Hokkai-do (8,862 persons), Hyogo-ken (7,409 persons), Niigata-ken (6,735 persons), and so on. The rate of negative net-migration in Aomori-ken (0.50%) was the highest, followed by Akita-ken (0.44%), Nagasaki-ken (0.43%), and so on.
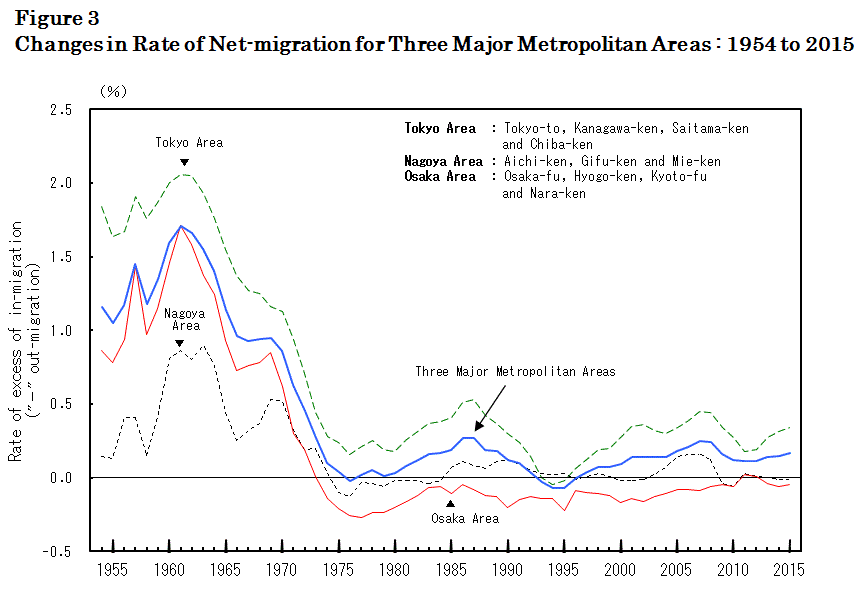
The number of positive net-migration for Tokyo Area had increased by 9,949 persons. Nagoya Area and Osaka Area had negative net-migration for the third straight year
- The net-migration for all three major metropolitan areas (Tokyo Area, Nagoya Area and Osaka Area) had a positive net-migration of 108,913 persons. This was the twentieth consecutive year to have positive net-migration. Compared with the previous year, positive net-migration increased by 12,030 persons for these areas.
- The Tokyo Area had a positive net-migration of 119,357 persons. This was the twentieth straight year. The rate of positive net-migration was 0.34%, up 0.03 points from the previous year.
- The Nagoya Area had a negative net-migration of 1,090 persons. This was the third straight year. The rate of negative net-migration was 0.01%, unchanged from the previous year.
- The Osaka Area had a negative net-migration of 9,354 persons. This was the third straight year. The rate of negative net-migration was 0.05%, down 0.01 points from the previous year.
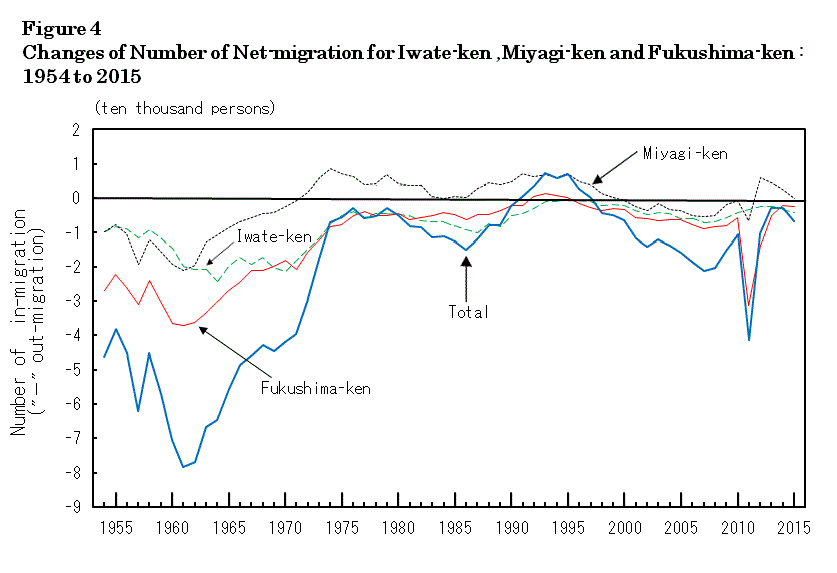
The total number of negative net-migration for Iwate-ken, Miyagi-ken and Fukushima-ken was 6,593, compared with the previous year, negative net-migration increased by 3,619 persons in these areas
- The total number of negative net-migration for Iwate-ken, Miyagi-ken and Fukushima-ken was 6,593, compared with the previous year, negative net-migration increased by 3,619 persons in these areas.
- Iwate-ken and Fukushima-ken had negative net-migration, which was unchanged from the previous year. The net-migration in Miyagi-ken changed from positive to negative. Negative net-migration in Miyagi-ken was the first time since 2011.
![]()
![]()